Delta View: Variances Between Budgeted & Forecasted Amounts
The Delta View helps you evaluate the difference between the budgeted amounts in your capital budget and the combined Actual and Forecasted amounts for projects. It highlights variances, identifies non-budgeted impacts, and helps you monitor overall budget adherence.
What is the Delta View?
At its core, the Delta View represents the difference between two “worlds”: what’s inside (the budgeted amounts in the capital budget) and what’s outside (the actual and forecasted spending). Or, in simple terms:
Inside - Outside = Delta
The Delta View helps answer critical questions:
How big is the difference between budgeted and planned amounts for each request across months, quarters, or years within the entire budget period?
How big is the difference between the total budgeted amount and what is currently planned for each request?
Which non-budgeted requests are affecting the budget, and by how much?
By breaking down these variances, the Delta View provides insights into how closely your capital budget aligns with reality.
Key Details
Budgeted Amounts
The planned allocations set for each project within your capital budget. These represent the financial targets or limits established for each project.
Forecasted Amounts (Actual + Forecasted)
The forecasted amount represents the current total expected spend for each project, as displayed in the Expenditure tab of the project in the Capex Management module. It combines:
Actual Expenditures: Costs that have already been incurred.
Forecasted Projections: Anticipated future costs for the project.
For non-approved projects, the forecasted amount equals the requested amount, as there is no finalized forecast available yet.
Delta (Variance)
The calculated difference between the budgeted amounts and the actual + forecasted amounts. The delta indicates whether a project is:
Over Budget: When the forecasted spend exceeds the budgeted amount.
Under Budget: When the forecasted spend is below the budgeted amount.
How to Use the Delta View
Open the Budget
Navigate to the specific capital budget you wish to analyze.Enter the Investment Plan
Access the Investment Plan, where all project requests are listed.Select Delta
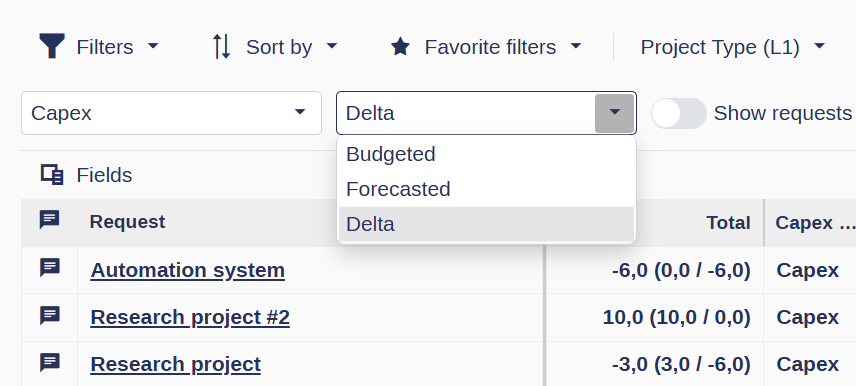
From the drop-down menu above the project list, select the Delta option.
Understanding the Delta View: Amounts and Formatting
The Delta View uses intuitive colors, fonts, and formatting to make variances and spending trends easy to interpret. These visual cues help you quickly spot potential budget issues and identify areas needing attention.
Delta Totals
The Total field in the Investment Plan shows:
Actual Spend Delta: The variance between the budgeted and actual spending.
Forecasted Spend Delta: The variance between the budgeted and forecasted spending.
These two values are summed to calculate the Total Delta for the project.
Example
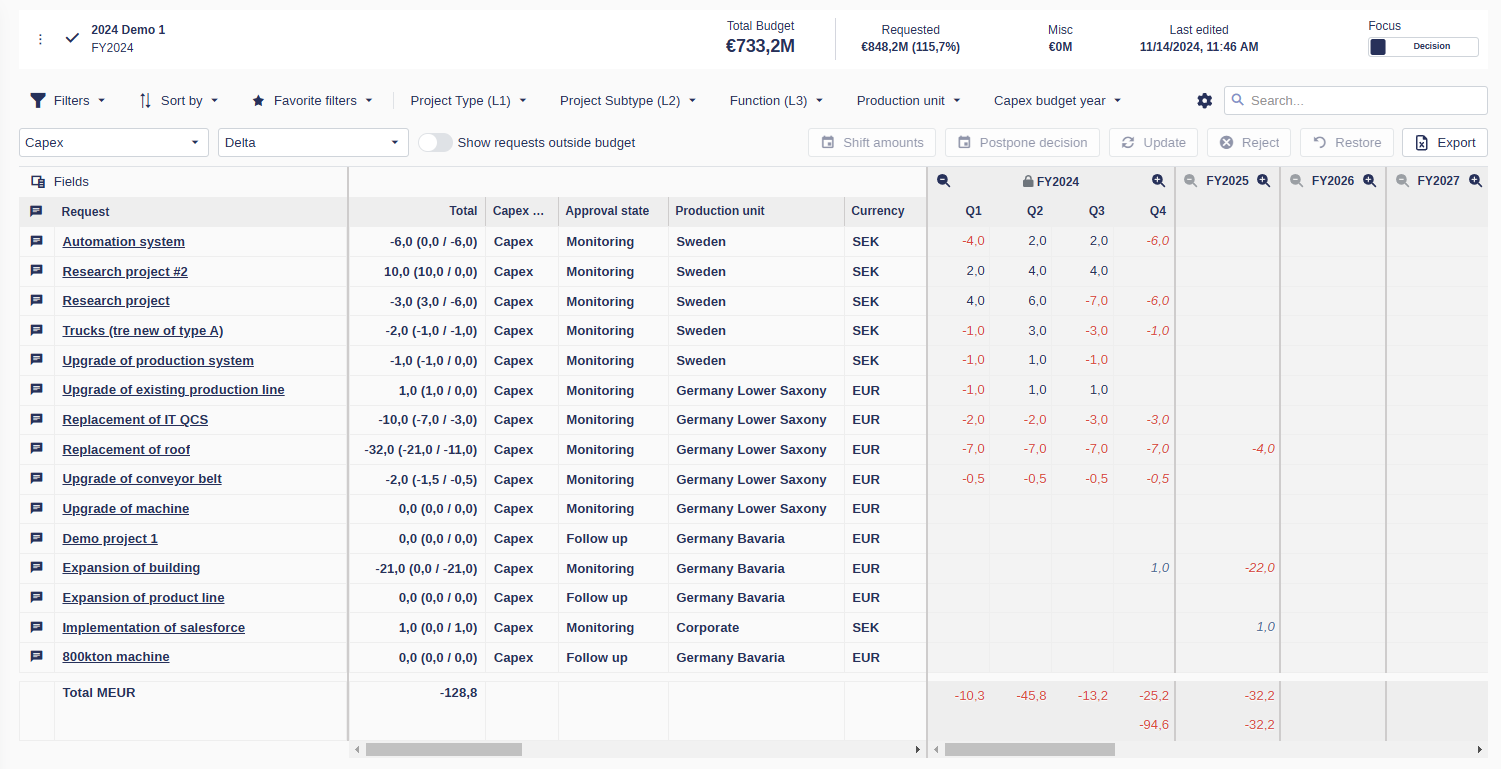
In the screenshot below for the project "Automation System," the Total Column displays:-6,0 (0,0 / -6,0)
This corresponds to:
Total Delta: -6.0
Actual Delta: 0.0
Forecasted Delta: -6.0
What This Means
For this project, during the outlays in 2024:
In Q1, the project exceeds the budget by 4.
In Q2 and Q3, the project spends less than the capital budget by 2 each quarter.
In Q4, based on the latest forecast, the project is expected to overspend by 6.
Overall, the actual spend aligns with the total budgeted amount, but the project is forecasted to overspend by 6 in Q4, exceeding the initial budget.
Variance Formatting
Over Budget: Highlighted in red for projects exceeding the capital budgeted amount.
Under Budget: Displayed in black for projects forecasted to spend less than the capital budgeted amount.
Forecasted Differences: Shown in italicized text to indicate projected variances.
Number Formatting Based on Timing
Formatting varies depending on whether values are historical (before the forecast starts) or future (after the forecast starts):
Historical Values (Before Forecast Start Date):
Positive numbers (>=0): Shown in black with a normal font.
Negative numbers (<0): Displayed in red.
Future Values (After Forecast Start Date):
Positive numbers (>=0): Shown in italicized black.
Negative numbers (<0): Displayed in italicized red.
Projects that have not been approved in the Capex Management module do not have a forecast start date. These projects will appear in normal, non-italicized text, regardless of their status.
Why Use the Delta View?
The Delta View provides actionable insights by showing:
Variances for each project across time (month, quarter, year, or entire budget period).
Total differences between what’s budgeted and currently planned.
Non-budgeted requests that affect the overall budget and their impact.
This feature ensures you have full visibility into your budget's performance, allowing you to make informed decisions and take corrective actions when necessary.


