Capital Budget Overview
The Overview tab provides a centralized view of your Capital Budget, displaying key financial data, summaries, and interactive charts. It allows you to quickly assess budget details, track requested and approved amounts, and analyze spending trends.
Capital Budget Summary Row
The Capital Budget Summary Row provides a quick, high-level overview of key budget details at the top of the Capital Budget screen. It includes:
Budget Name – The name of the capital budget.
Total Budget Amount – The sum of the budgeted amount and any miscellaneous/contingency funds, displayed based on the selected Decision Focus or Spend Focus.
Requested Amount – The total amount requested, along with its percentage relative to the total budgeted amount. (Note: Not all requested funds are necessarily included in the final budget.)
Miscellaneous/Contingencies – Additional budgeted amounts, categorized by focus type, along with their percentage of the total budget.
Last Edited Date & Time – The most recent timestamp indicating when the budget was last modified.
Focus Selection – Indicates whether the budget is displayed in Decision Focus or Spend Focus.

Use historical FX rates
When a capital budget is approved, the applicable FX rates are automatically saved. These rates can be used to check data against historical exchange rates.
Applying Historical FX Rates
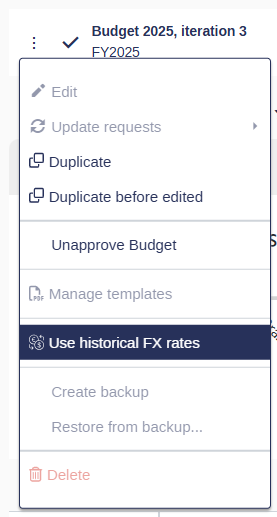
To apply historical FX rates:
Open the context menu for the Capital Budget.
Select "Use historical FX rates" (if available).
When historical FX rates are applied, an indicator appears in the Capital Budget's top bar.
If needed, you can switch back to current FX rates using the context menu option “Use current FX rates”.
Capital Budget Focuses
The capital budget includes two key focus areas: Decision Focus and Spend Focus, each serving a distinct purpose in budgeting and tracking project expenditures.

Decision Focus
Represents the total approved (or to be approved) amount for projects within the capital budget period.
Includes projects where the Capex budget year (ID 4) falls within the budget period.
Excludes carry-over projects (i.e., projects already approved in a previous budget year but with actual outlays in the current budget year).
Decision focus looks at when a project is decided, not when the money is spent.
Calculation
Sum of “Budgeted amount total” (ID 59) for all requests included in the Capital Budget.
Plus: Total allocated Miscellaneous/Contingency amount added in Decision Focus.
Miscellaneous/Contingency in Decision Focus
Covers budgeted amounts for unplanned projects, such as:
Projects approved outside the capital budget.
Projects approved with a higher amount than originally budgeted.
Includes the total amount approved to be spent across all years.
Spend Focus
Represents the total amount budgeted to be spent in the first budget year.
Includes carry-over projects, but only accounts for the spending expected the first budget year (excluding any amounts spent in prior years).
Spend focus looks at when money is actually spent, regardless of when the project was decided.
Calculation
Sum of “Budgeted amount spend this year” (ID 64) for all requests included in the Capital Budget.
Plus: Total allocated Miscellaneous/Contingency amount added in Spend Focus.
Miscellaneous/Contingency in Spend Focus
Used for any unplanned spending in the first budget year, including:
Budgeted projects that overspend.
Projects approved outside the budget with actual spending in the current year.
Decision vs Spend examples
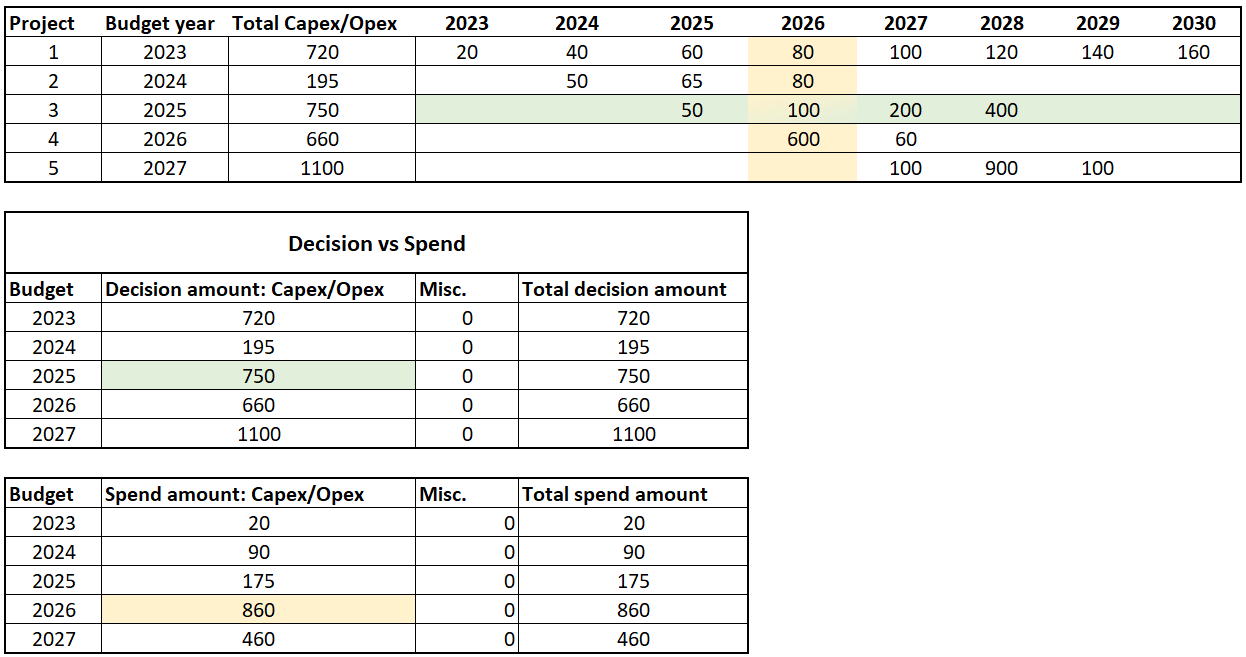
Decision Focus
Example: Capex budget year = 2025
Project 4 is the only project with outlays starting in 2025.
Since it is a multi-year project, all its outlays are aggregated: 50 + 100 + 200 + 400 = 750
Spend Focus
Example: Capex budget year = 2026
Projects 1, 2, 3, and 4 all have outlays in 2026.
All outlays for that specific year are aggregated: 80 + 80 + 100 + 600 = 860
Capital Budget Charts
The Budget Overview provides interactive charts that offer clear insights into capital budgets, helping you analyze financial data at a glance. These charts are predefined by your administrator and apply to all Capital Budgets, ensuring consistency across your organization.
The charts are responsive and adjustable based on your screen size.
If multiple charts are enabled, you can navigate between them using the left and right arrows.
For more details on configuring the charts, refer to the Capital Budgeting Charts documentation.
System Charts
Weissr Capital Budget includes three predefined system charts that can be enabled using toggles
Budget Status – A bar chart displaying budgeted vs. actual spending for CAPEX and OPEX across different production units.
Budget Status Aggregated – Similar to Budget Status but aggregates CAPEX and OPEX data across all production units.
Requested Capex Amount per State, Spend Amount – Breaks down requested capital expenditure amounts by state and spending category.
Budget Status Charts
Budget Status Charts visually represent budget requests within a budget, including data from requests that meet the Capital Budget inclusion criteria but are technically outside the budget. These charts are available in the Budget Overview section.
There are two types of Budget Status Charts:
Single Production Unit – Displays data for each production unit.
Aggregated – Summarizes data across all production units, including both in-budget and outside-budget amounts.
Data Used in Budget Status Charts
Budget Status Charts are logically divided into three main components:
Requested Data – Represents requested amounts for the projects.
Allocated Data – Represents planned and assigned budget amounts.
Outcome Data – Represents approved and actual spending outcomes, this data is based on the actual spending within Weissr Capex Management Module.
Charts can be displayed in either of the following views, depending on the selected focus:
Decision Focus – Displays planned and approved amounts for the full investment lifecycle.
Spend Focus – Displays planned and approved amounts for the budget period.
Key Features of the Budget Status Charts
X-Axis: Represents different production units (e.g., USA West, Canada, Germany Bavaria) or aggregated in a single group unit.
Y-Axis: Represents capex and opex amounts in your user-settings-defined currency.
Bars and Colors:
Black – Requested amount (originally planned before final approval).
Blue – Budgeted amount (approved allocation within the capital budget).
Light Blue – Miscellaneous/contingency allocated per production unit (manually entered adjustments in the Miscs/Contingencies tab.).
Dark Green – Outcome budgeted (approved and utilized within the budget).
Light Green – Outcome non-budgeted (spending that occurred outside the allocated budget).
Legend: Located on the right side, explaining the meaning of each color.
Example: Budget Status Chart
The Budget Status Chart is a bar chart displaying financial data related to budgeted and actual spending across different production units.
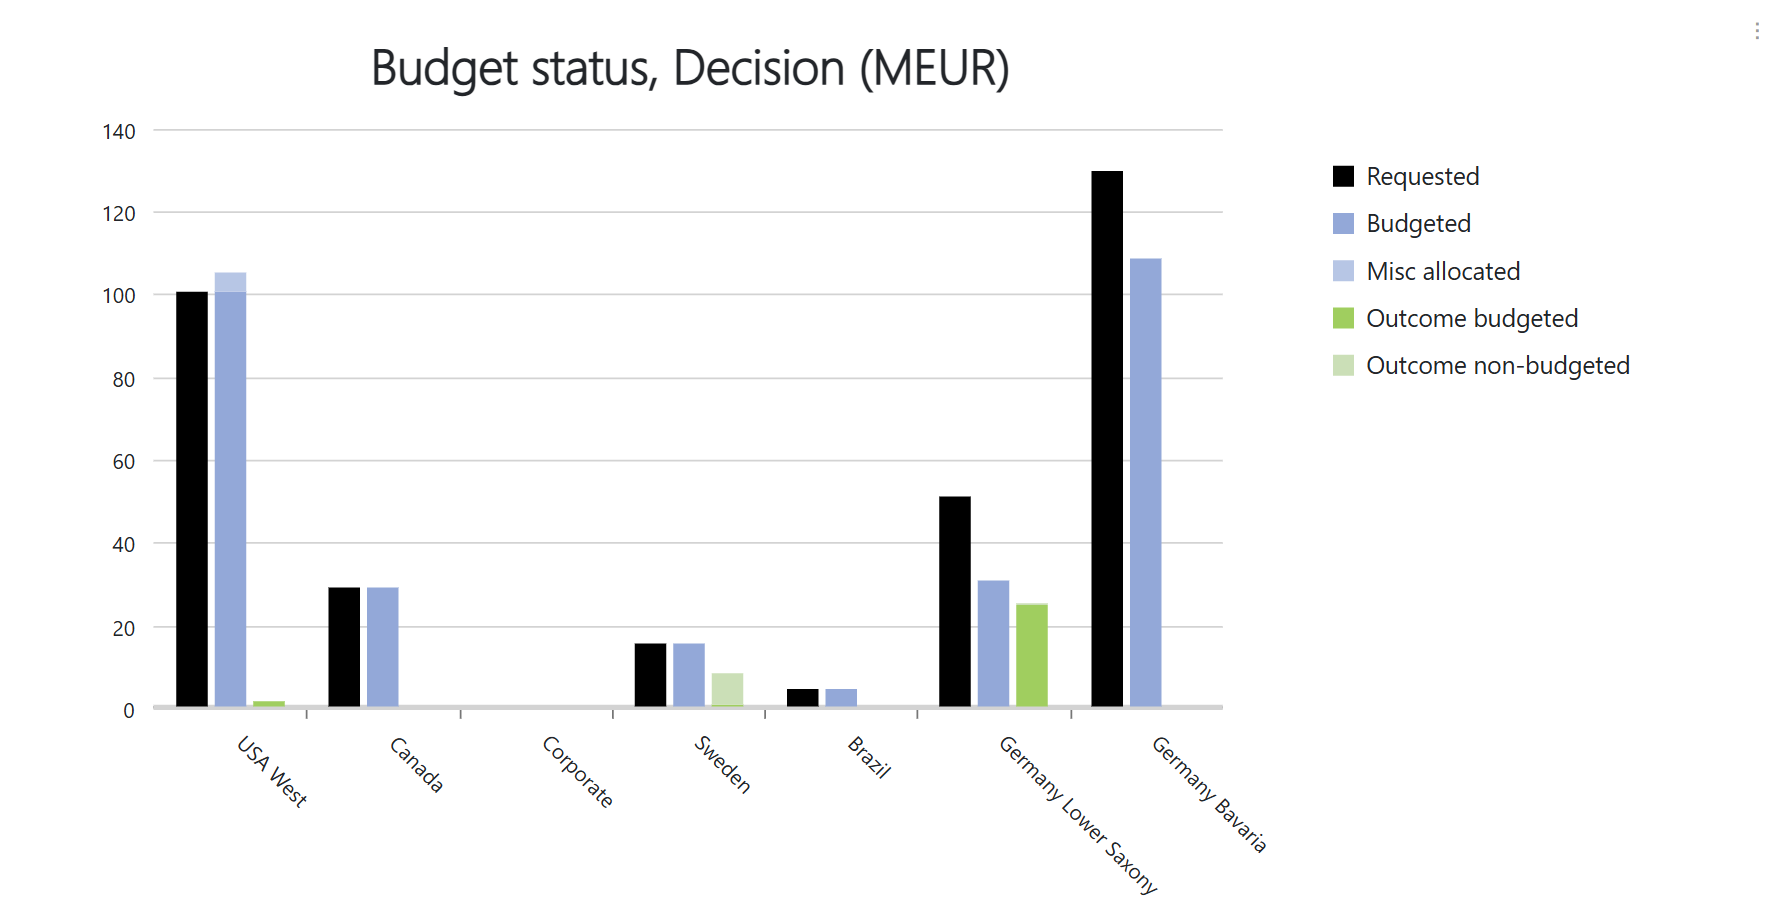
Decision Focus
Displays the total approved (or to be approved) amount for the full investment lifecycle.
Excludes carry-over projects, which are projects approved in a previous budget year but with actual outlays in the first budget year of the new budget period.
If a request was outside the budget but later received final approval in the Capex Management Module, the full approved amount is treated as Outcome Non-Budgeted.
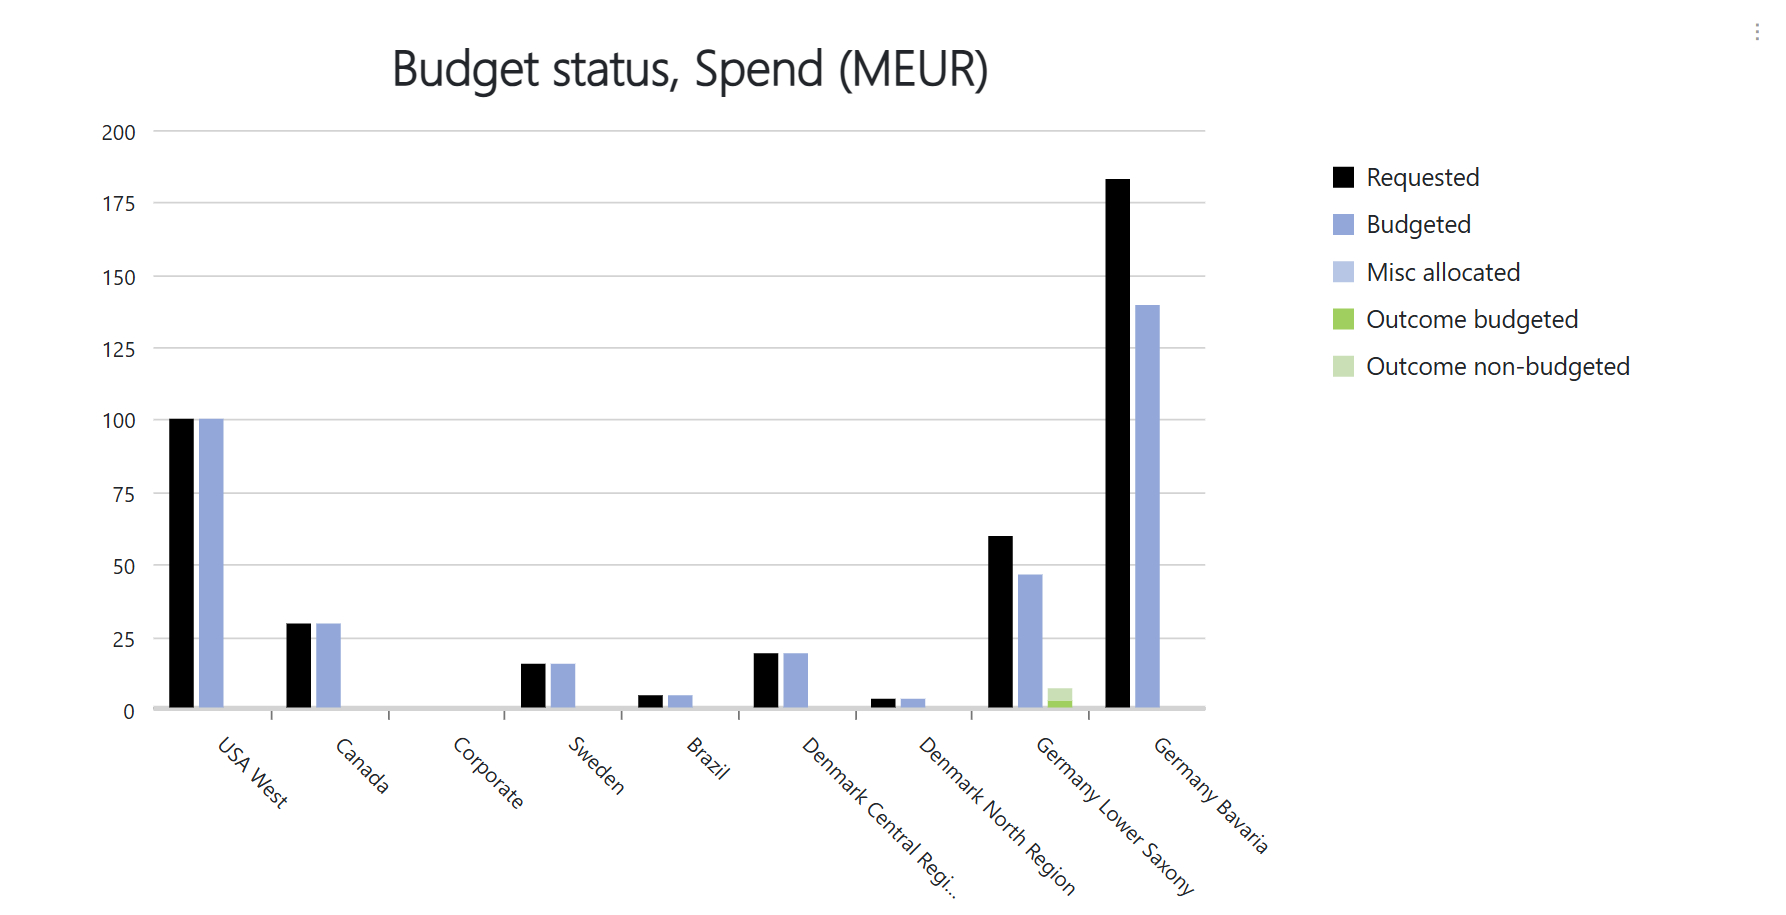
Spend Focus
Displays the total amount budgeted to be spent in the current budget year.
Includes carry-over projects, which are projects approved in a previous budget year but with actual outlays in the first budget year of the new budget period.
Includes overspending: If a request exceeds the originally budgeted amount, the overspent portion is treated as outcome Non-Budgeted. If a request was outside the budget but later received final approval, the actual spent amount is treated as outcome Non-Budgeted.
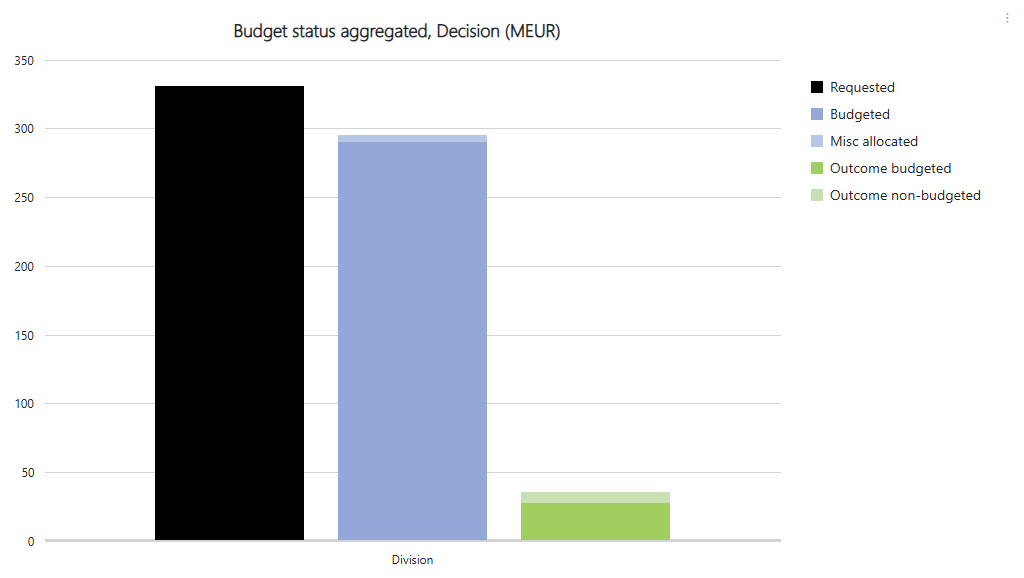
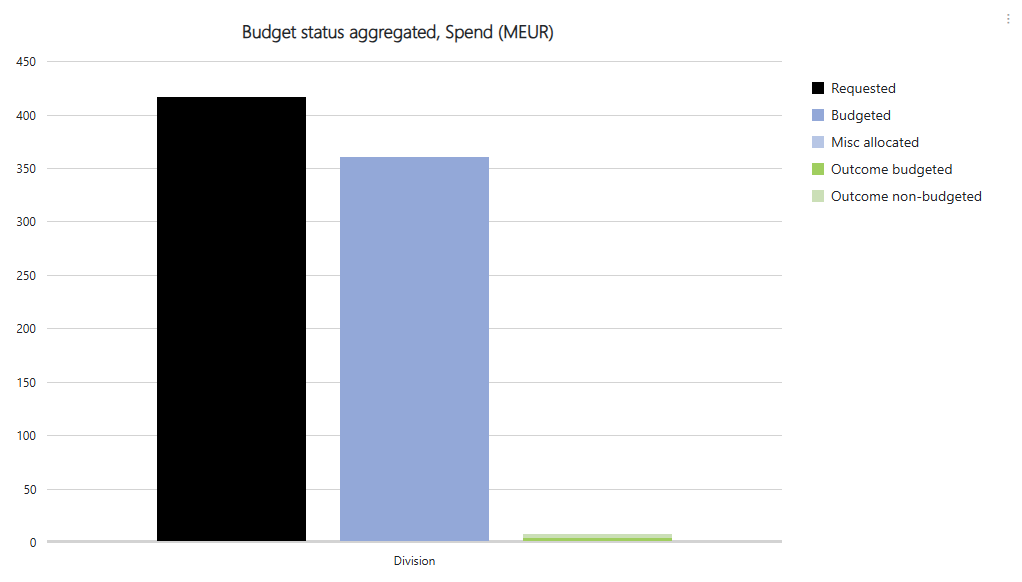
Example: Budget Status Aggregated Chart
The Budget Status Aggregated Chart is a bar chart that provides a high-level overview of total Capital Expenditures (CAPEX) and Operational Expenditures (OPEX) across all production units.
Summarizes budgeted and actual spending across the organization.
Behaves the same as the Budget Status Chart, but with data aggregated for all production units.
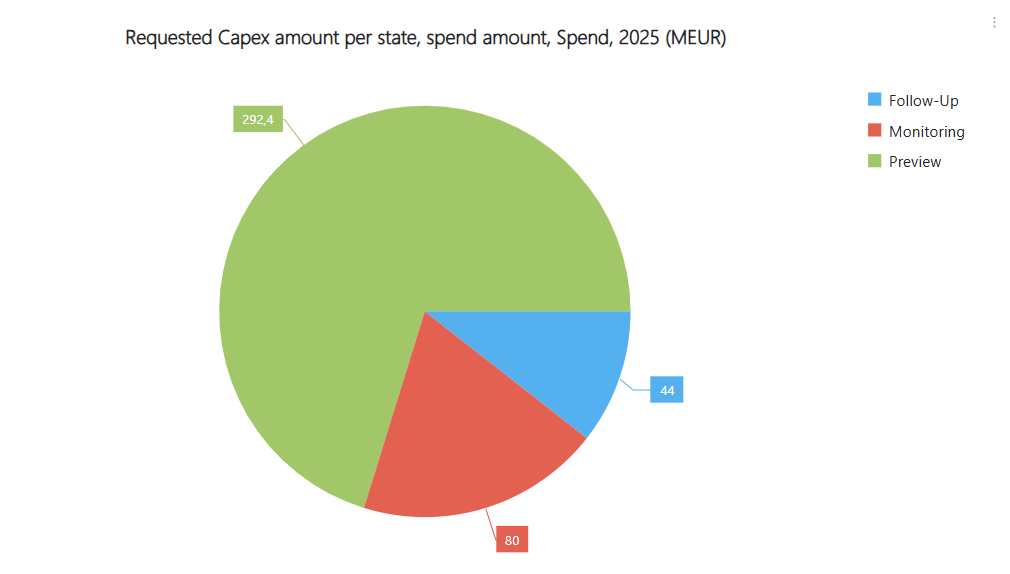
Requested Amount per State Chart
The Requested Amount per State Chart is a pie chart that visualizes the requested spending amount for the first budget year, categorized by project phases.
Chart Overview
Chart Type: Pie Chart
Represents: The total requested amount for each project phase in the first budget year.
Purpose: Helps track how budget requests are distributed across different project phases
Project Phases in the Chart
Preview – Projects currently under approval.
Monitoring – Approved and ongoing projects.
Follow-up – Completed projects in the follow-up phase.