Version 4.12.2 (CM) - October 31st 2023
Below highlights the major improvements and additions in version 4.12.2:
Improvements in Forecast Start Date: Behaviour and Permissions
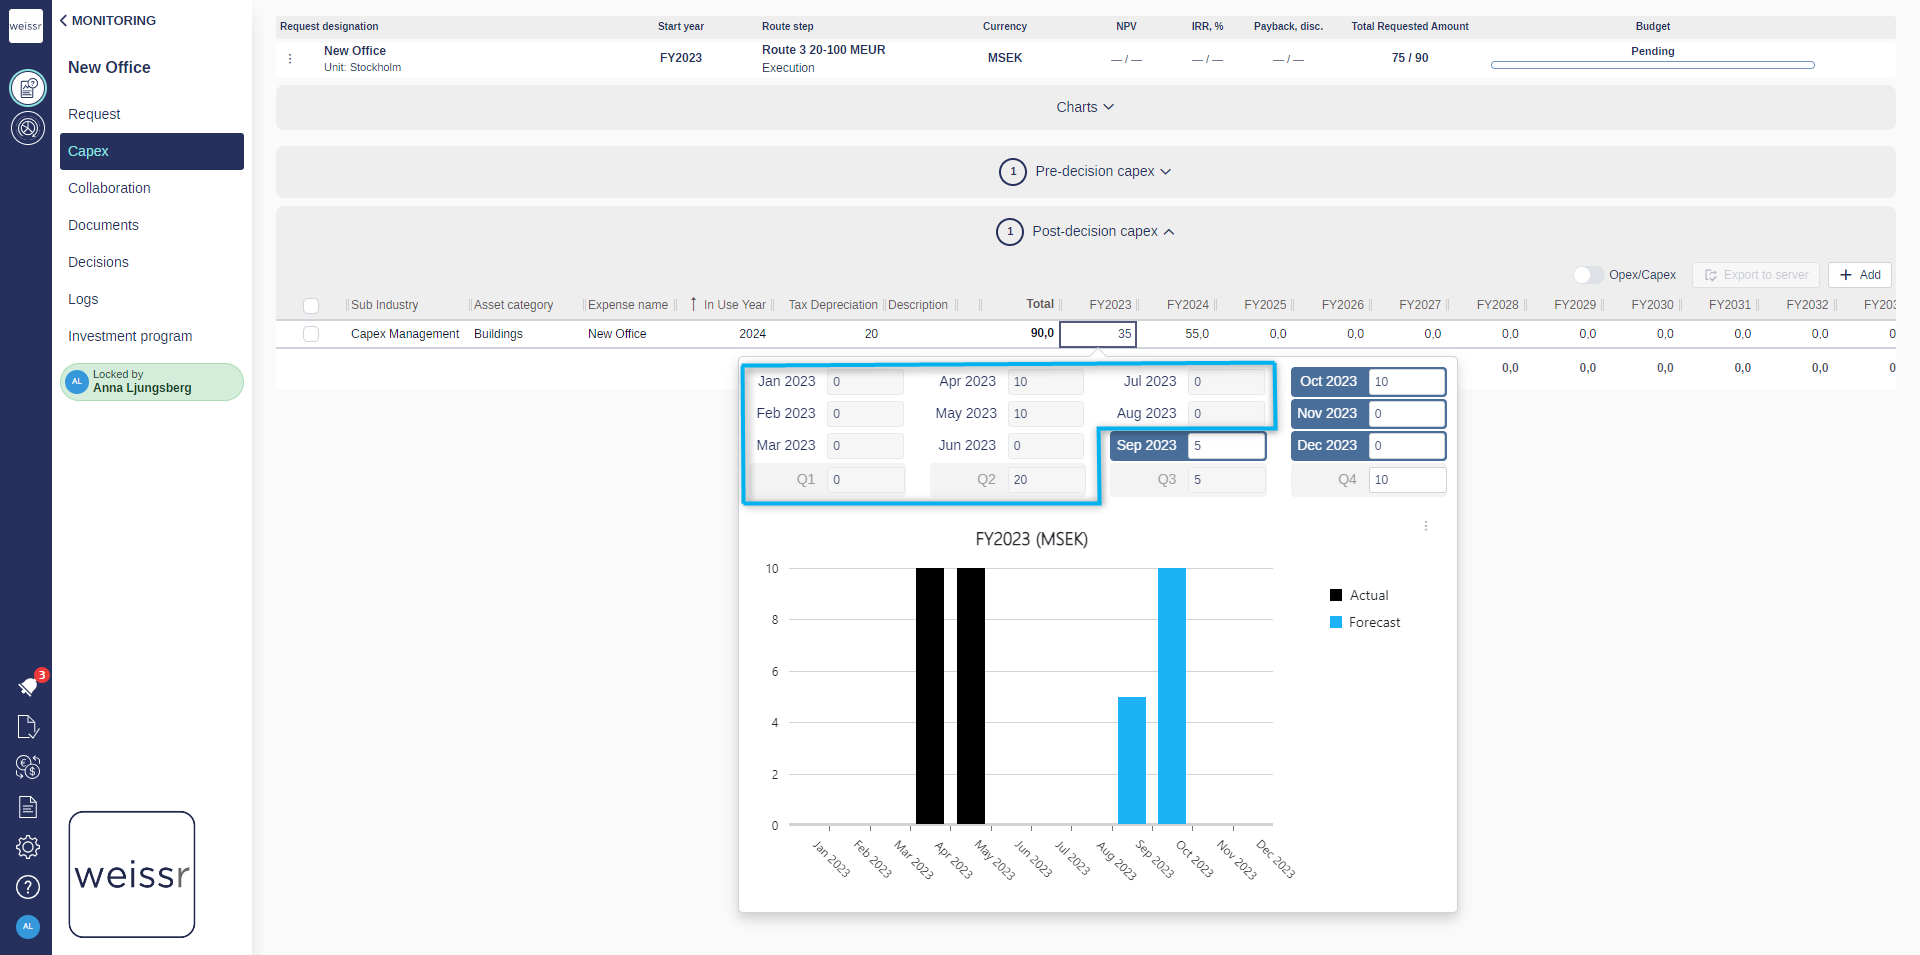
Previously, when manually editing the forecast start date, outlays prior to this date would appear visually different from forecasted outlays, yet all outlays remained editable. However, a disparity existed when importing actual outlays via methods such as actuals import, transactional data import, or SAP integration. In these cases, the forecast start date rendered the actual outlays as read-only.
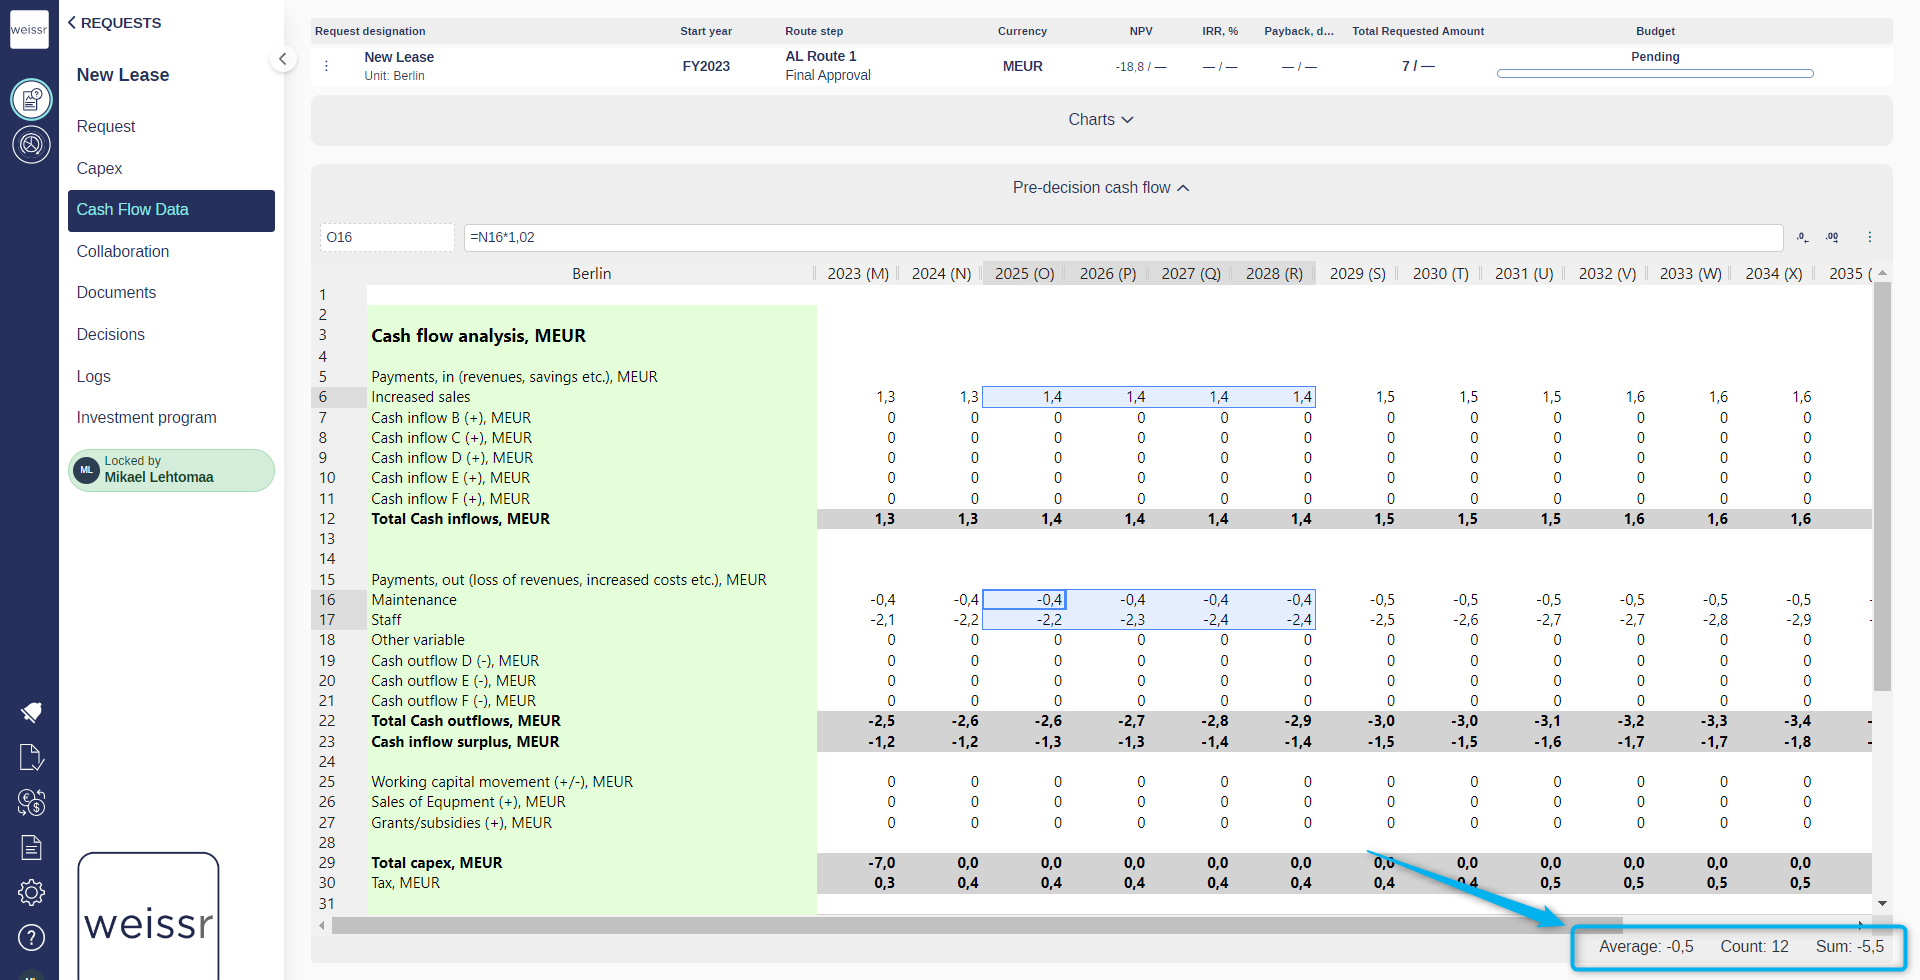
To create a more uniform and intuitive experience, we've aligned the behavior. Actual outlays will now be set as read-only if the forecast start date is configured and the outlays precede this date. As depicted in the image below, actual outlays are represented in gray to signify their read-only nature, while the editable forecast is distinguished by its highlighting in blue. This change ensures that the system consistently applies the editability rules, promoting a more predictable and user-friendly interface.
Public or Restricted Access
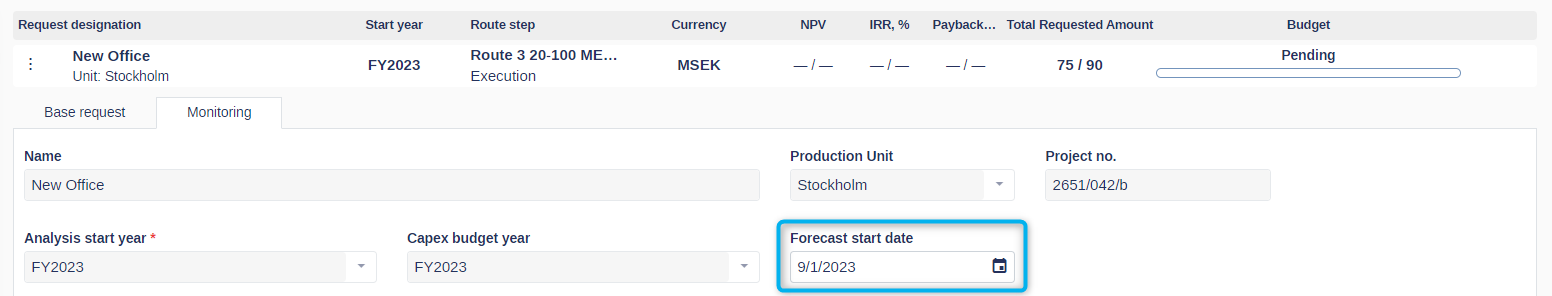
We now offer the option to designate whether the Forecast Start Date property is "public" or restricted, granting you greater control over who can view or edit this critical piece of data.
Is Public: When set as "public," it functions as it traditionally has, permitting all users with permission to access and modify it.
Restricted Access: When configured as restricted, administrators specify which user groups have the privilege to see or edit the Forecast Start Date value. This ensures that only users within designated user groups with the appropriate permissions can access and modify this critical property.
Enhanced Transactional Data and Period Management
We're excited to introduce improvements in how periods and actuals are managed in Weissr. With this enhancement, clients working with transactional data to import actual outlays ensure that actual values align accurately with real transactions, reducing the risk of incorrect outlays in incorrect months.
Key Updates:
Comprehensive Period Management: Period management now applies to all investment requests in the execution phase, ensuring consistency in tracking and managing actuals.
Zero Values for Missing Data: If no amount is imported through transactional data for requests upon period closing, the values for outlays in those requests will be automatically set to 0. This practice aligns with the expectation that imported values represent the definitive actual amounts.
Period management is currently only available for clients that use transactional data.
Expenditure Overview and Editing in Investment Programs
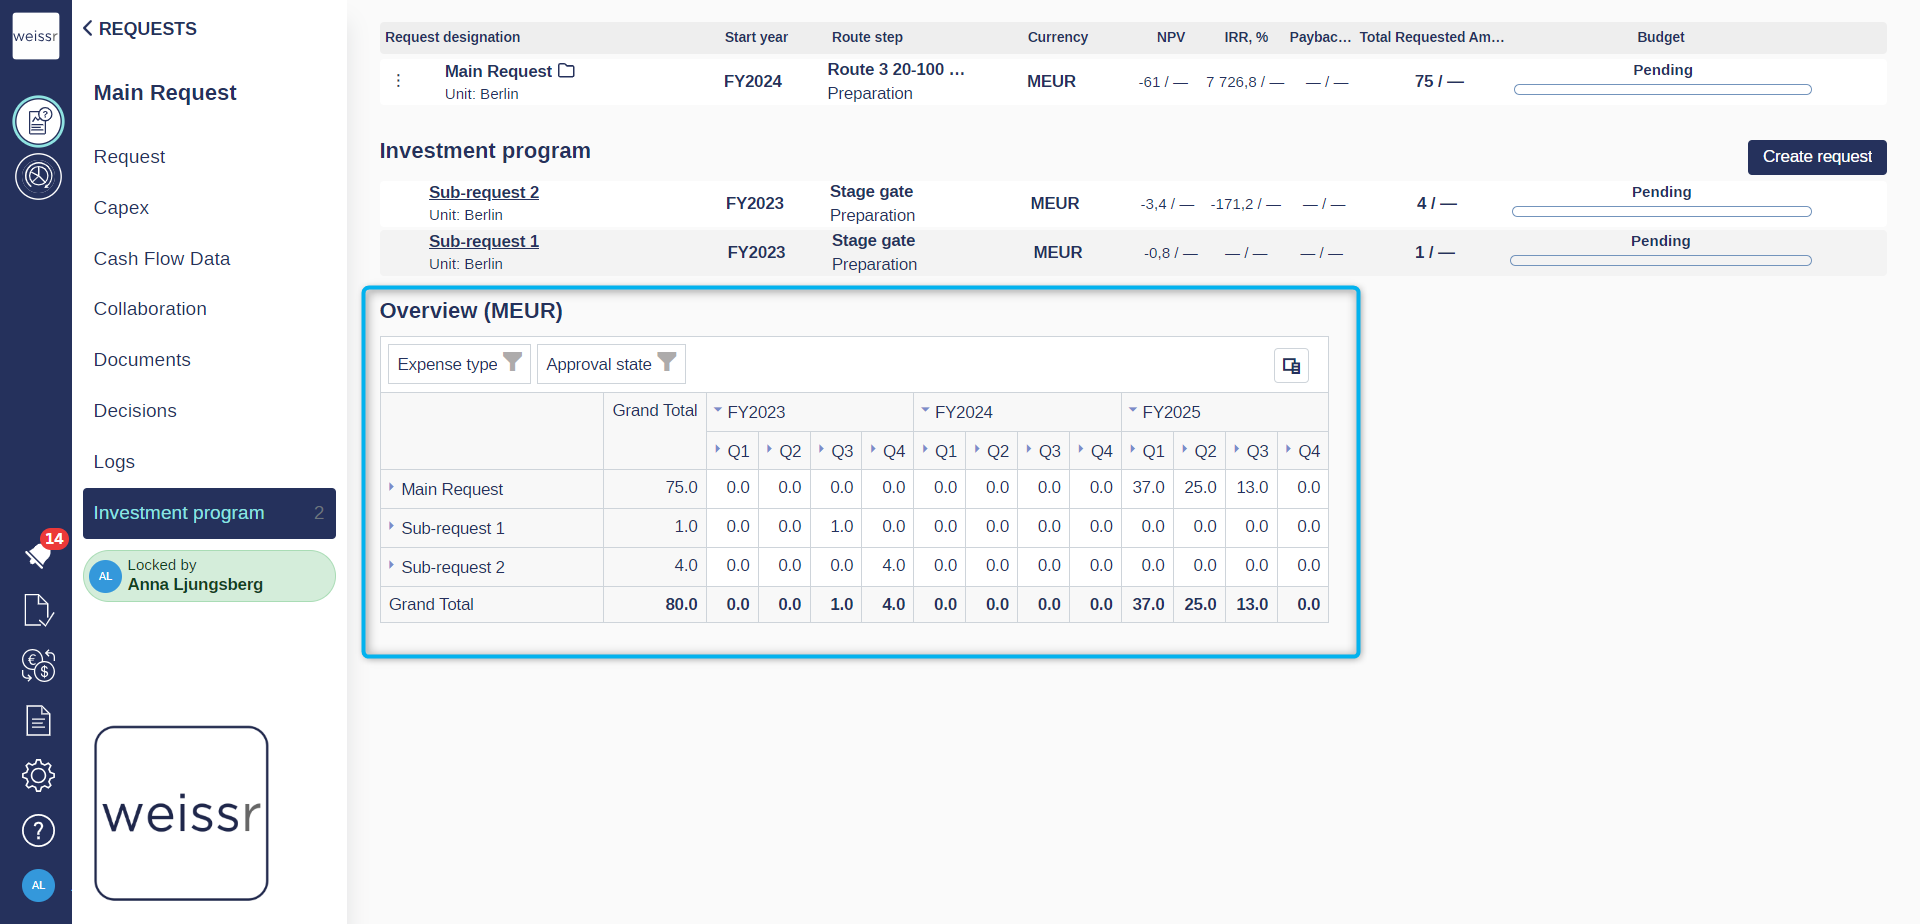
We are excited to introduce a comprehensive expenditure overview feature within the Investment Program page, offering a consolidated view of all expenditures from sub-requests and main requests in a single, easily accessible data grid.
Key Highlights:
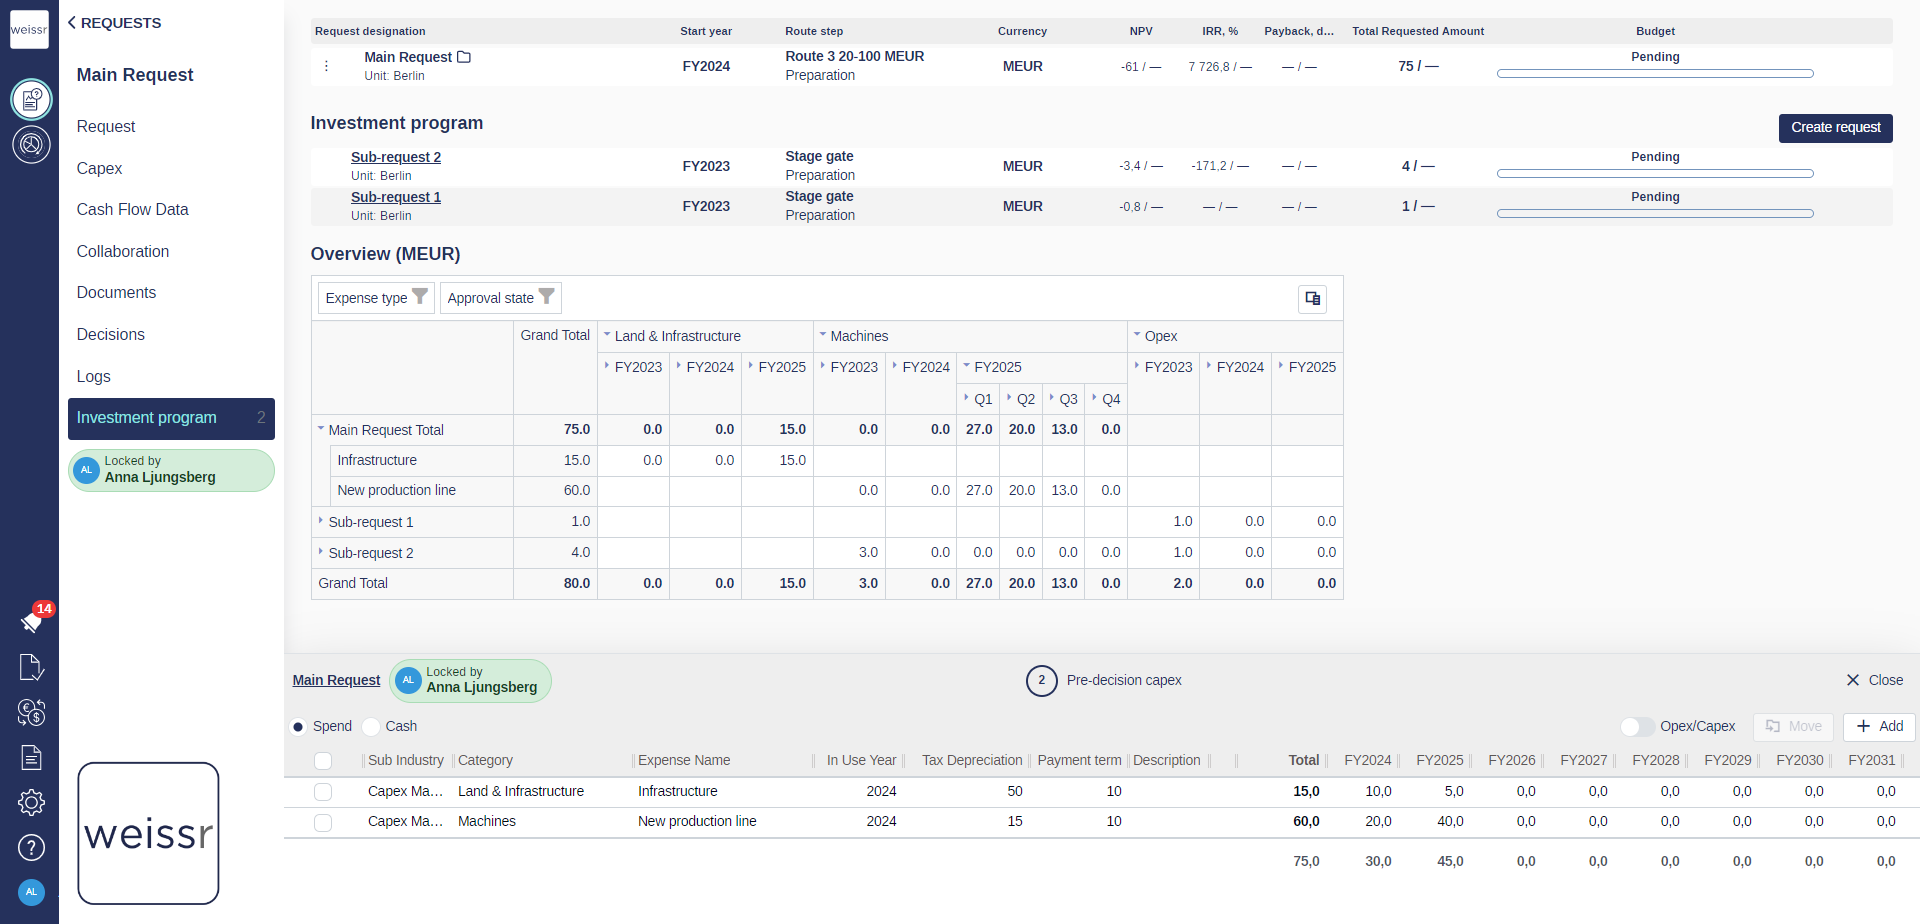
Simplified Data Visualization: The displayed data is organized and grouped by request and years, providing a clear overview of expenditures. All expenditures are presented in the main request's currency and are automatically converted based on the latest FX rates. The overview grid eliminates the need for excessive navigation, making it effortless to oversee all expenditures without switching between sub and main requests.
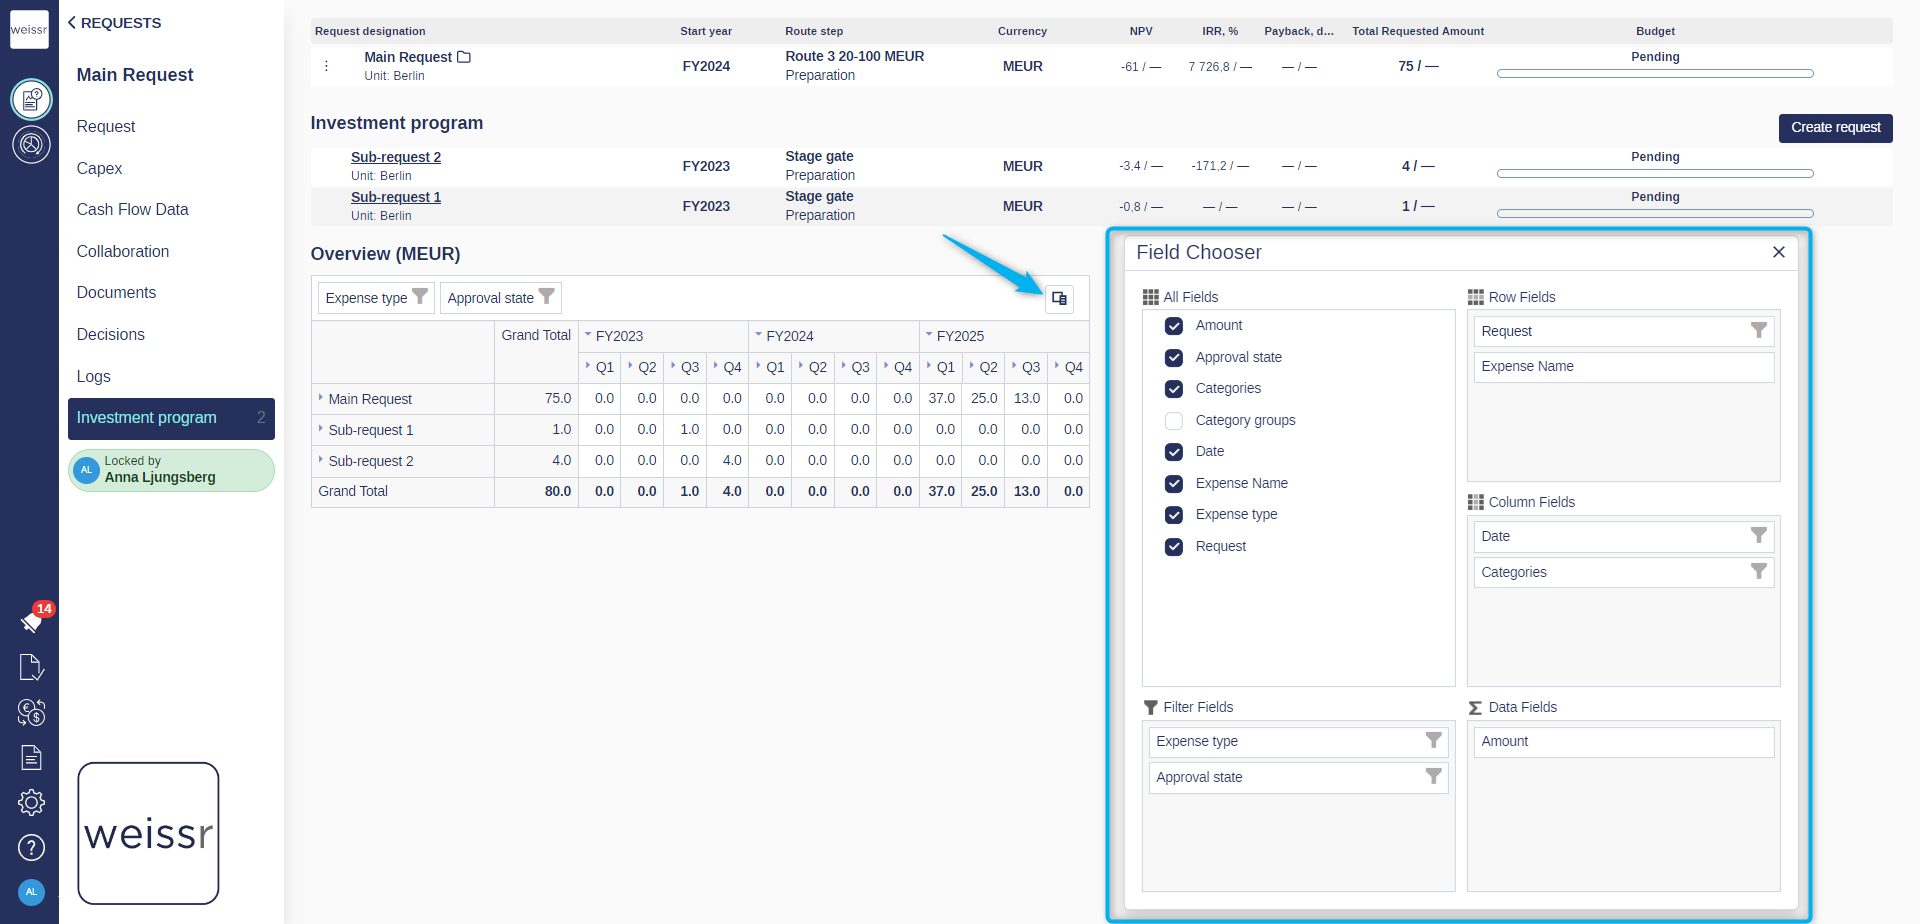
Efficient Data Manipulation: Seamlessly expand table rows and columns to reveal more in-depth information. Additionally, users can customize the grid's appearance by opening up the field chooser tailoring the presentation of data according to their preferences. Changes to the overview grid are saved per user, ensuring a personalized and streamlined experience for each team member.
Flexible Editing Capabilities: Enjoy the ease of editing values by simply double-clicking on a cell for the desired request or expenditure. This action triggers a split screen, displaying the request's expenditure grid for swift and convenient editing.
Automated Step Approval through Sub-Request Final Approval
As part of our ongoing commitment to improving the decision-making processes in Weissr, we introduce an enhancement that simplifies the approval process for investment programs/study phases. This update is designed to streamline workflows, reduce manual interventions, and enhance the accuracy of managing approvals.
Key Features:
Automated Step Approvals: Users can seamlessly connect a sub-request to a specific step in the parent request's route. When the sub-request receives its final approval, the corresponding step in the parent request is automatically approved. This automation ensures the main request progresses effortlessly along the approval route, reducing the need for manual actions while enhancing efficiency.
Workflow Flexibility: This feature ensures that your workflow remains adaptable and versatile, without any limitations on the utilization of other essential features like relations or dynamic routes.
With these enhancements, users can continue leveraging Weissr's full range of capabilities to tailor the platform to their unique needs, while experiencing a more efficient and reliable process for managing investment programs/study phases. Automating step approvals through sub-request final approvals streamlines workflows and reduces the risk of errors.
Spend to cash - Delta Adjustment and Real-Time Alerts
For clients utilizing the 'Spend to Cash' functionality, we have implemented enhancements to ensure a seamless alignment of spend and cash balances, particularly in scenarios involving modified payment terms and resulting disparities in closed periods.
Key Features:
Automatic Delta Adjustment: The system now automatically adjusts and transfers the delta between spend and cash to the first open period in the cash mode. This critical adjustment is pivotal in maintaining a balanced financial ecosystem, ensuring that spend and cash amounts are accurately synchronized.
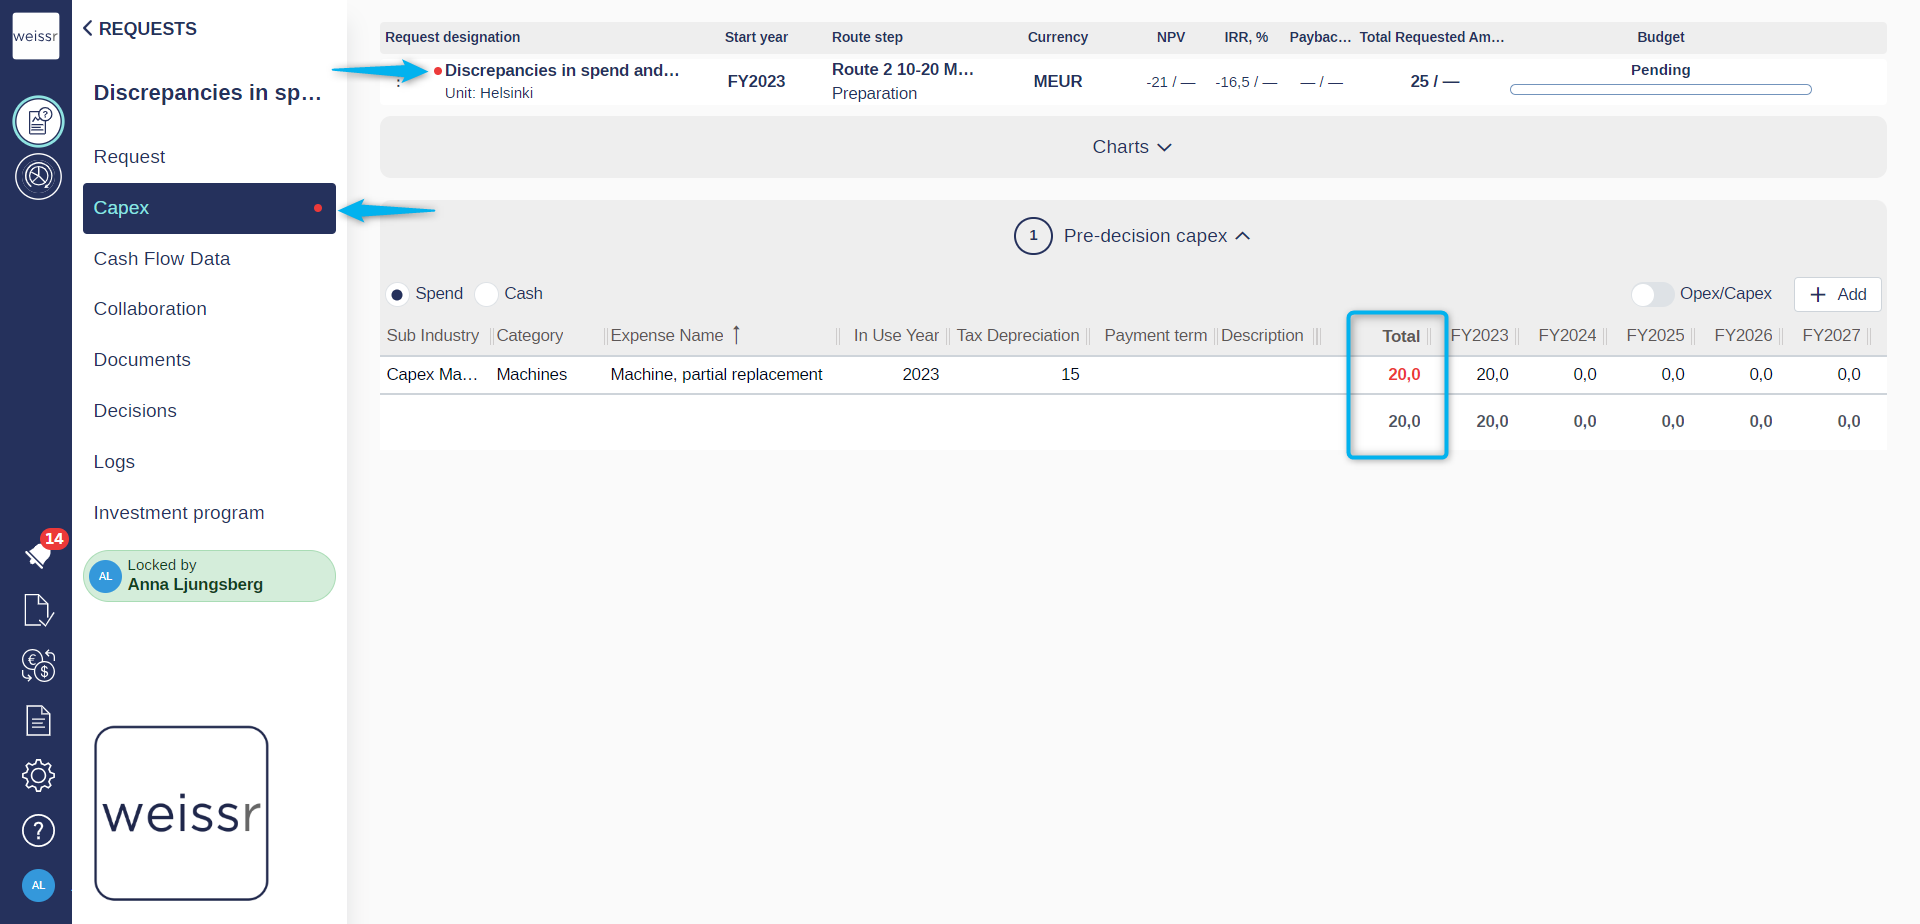
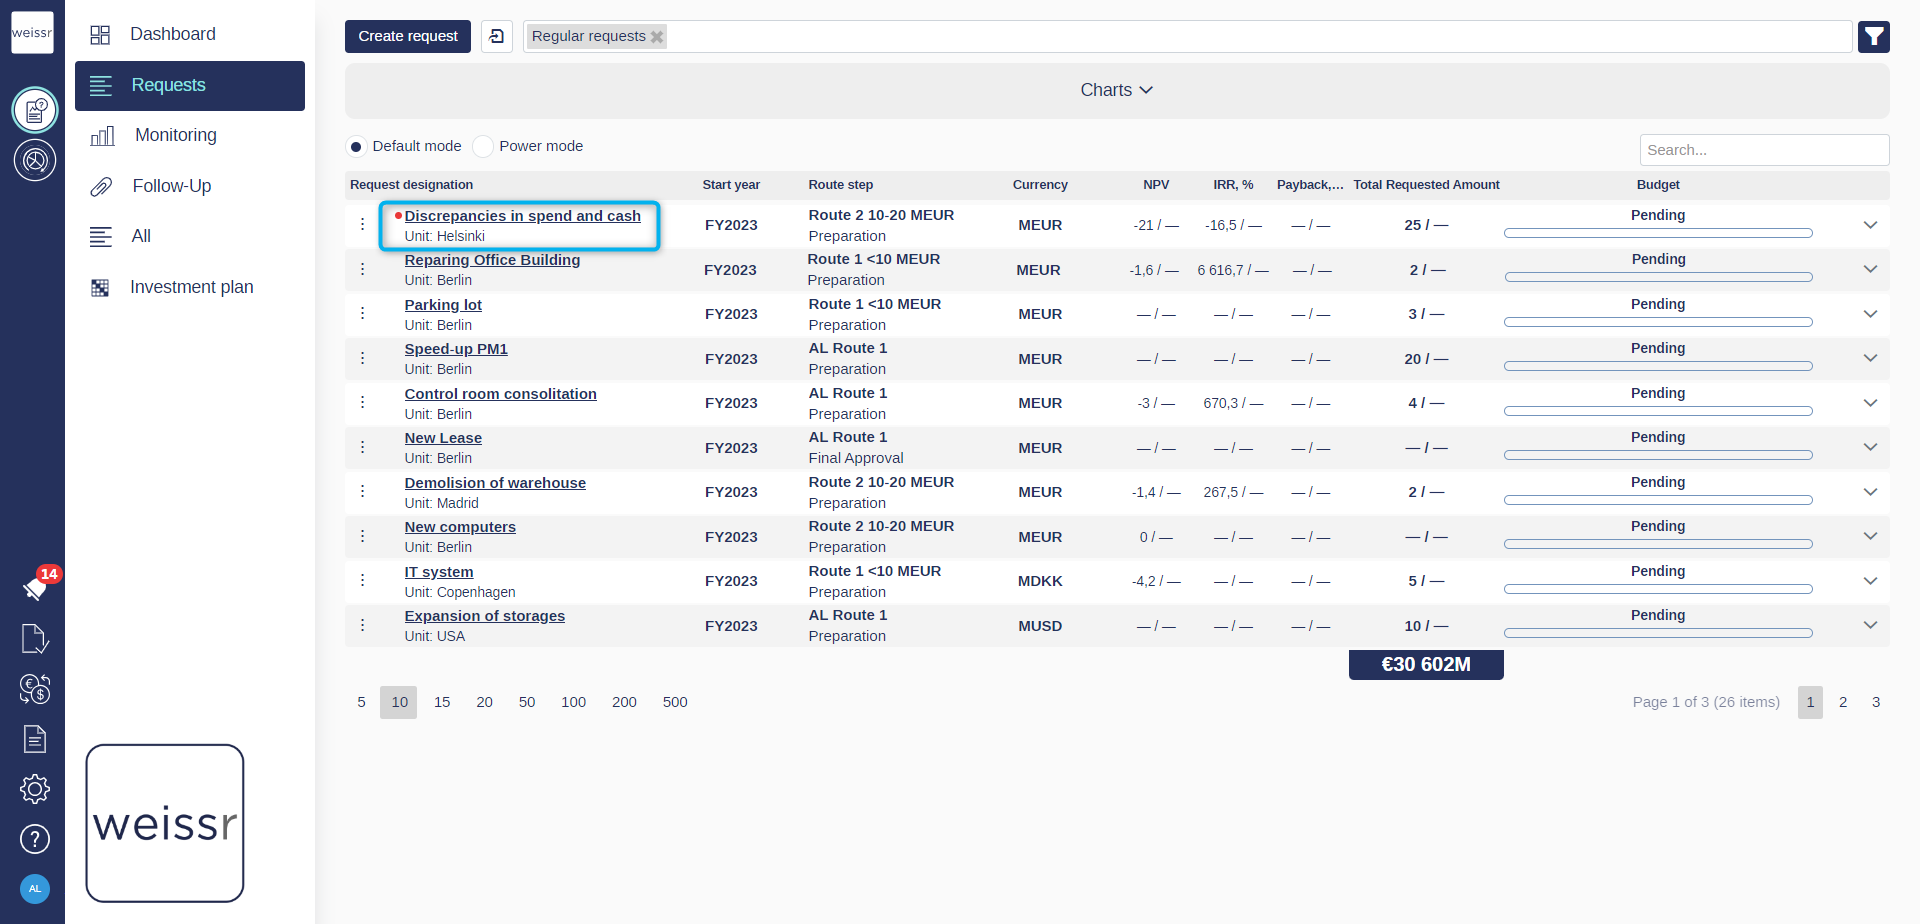
Real-Time Alerts: Users will now receive instant alerts if the total amount in spend mode diverges from the total amount in cash mode. This alert is visually highlighted (flagged) by a distinctive red marker on the total expenditure within the Capex tab. Furthermore, the affected request is prominently marked with a red dot in all request lists, serving as a visual indicator of any discrepancies. Detailed examples of these alerts are provided in the accompanying screenshots below for your reference.
Delta adjustment and real-time alert is only available for clients that use “Spend to cash”.
Cash flow model interface
To make the cash flow model more intuitive, we implemented “on-the-fly” calculations when selecting more than one non-empty cell (sum, average and count), showing up in the bottom-right corner of the screen.
Additionally, we have also implemented CTRL-selection of cells, allowing you to select several non-adjacent cells.
Efficient Reporting Database Export with Selective Investment Model Row
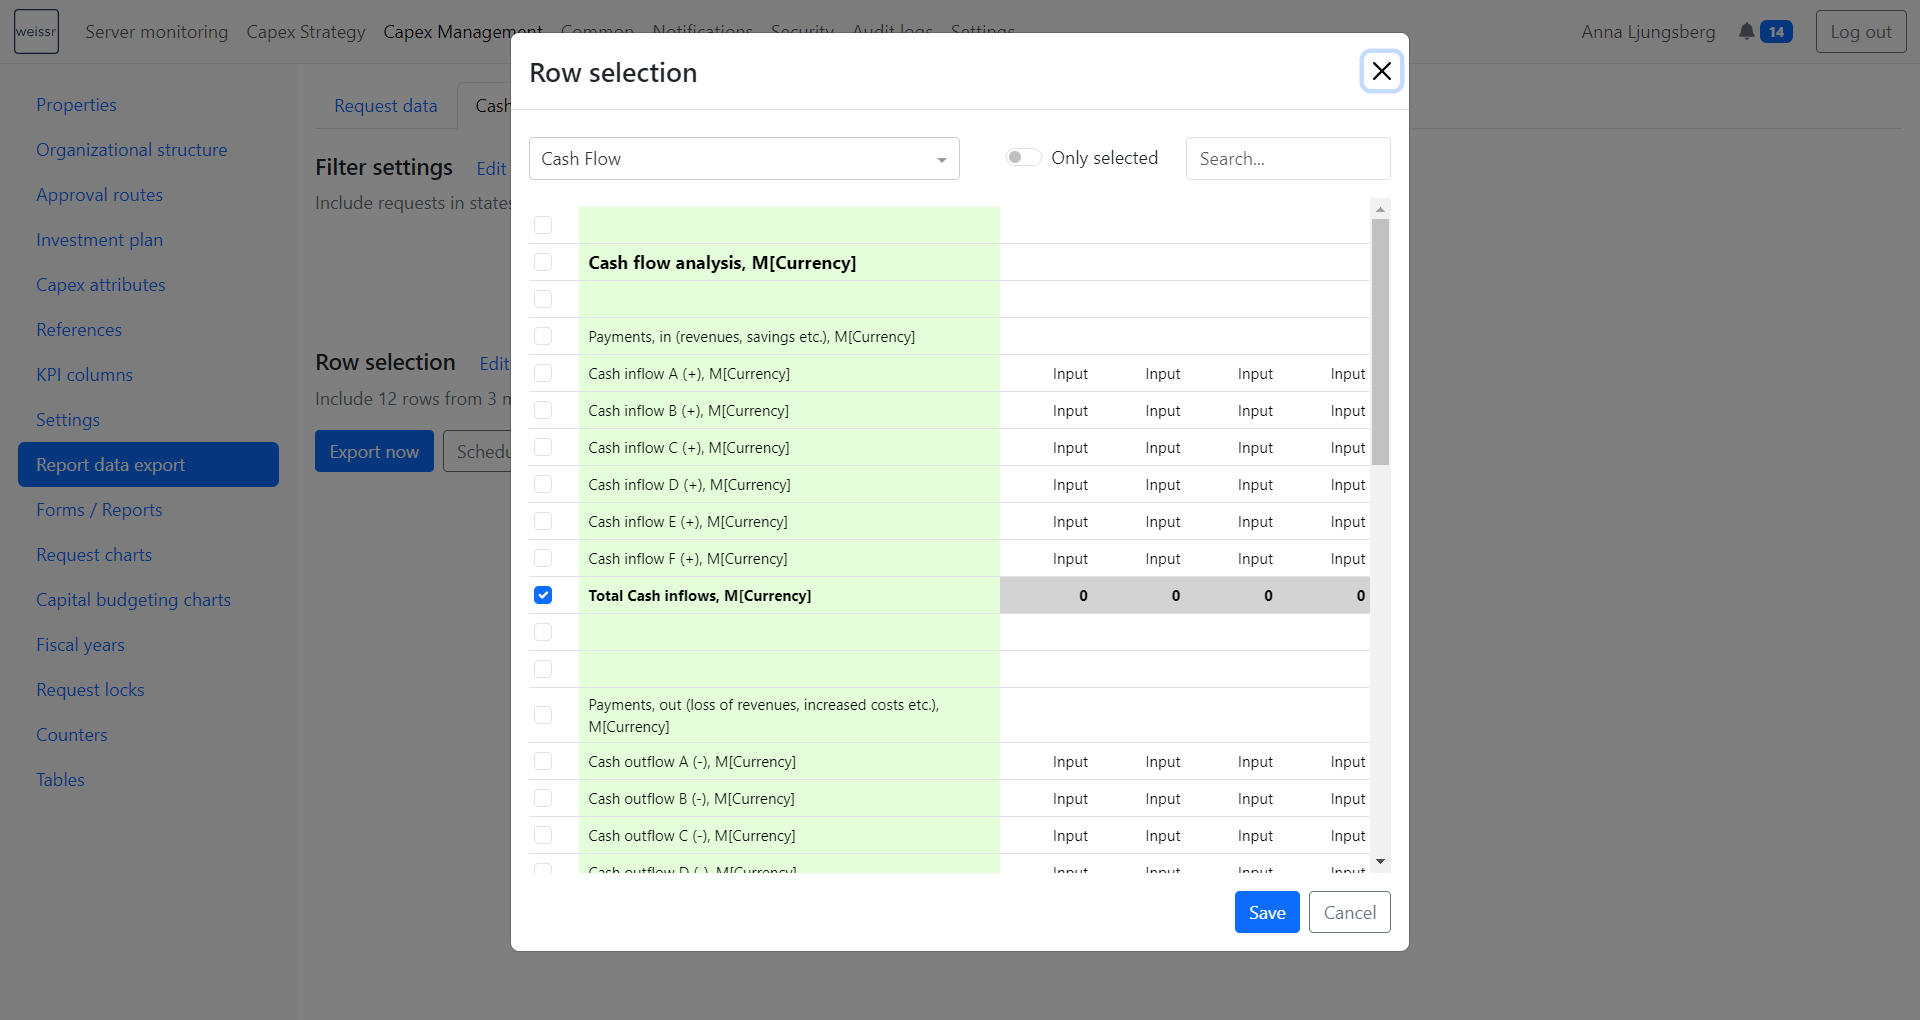
We are thrilled to introduce an administrative feature, empowering administrators to handpick specific rows from each investment model within Weissr for seamless export. This enhancement significantly streamlines the export process, ensuring that only the most relevant rows are included. With this tailored approach, exporting to the reporting database and CSV files is now quicker and more efficient than ever before.
The user-friendly interface for selecting rows mirrors the familiar layout of the investment model in the UI, simplifying the process of identifying and choosing the relevant data rows. Additionally, users can leverage the search functionality to filter rows and effortlessly identify all selected rows, allowing for a more focused view of the selected data rows.