Version 4.12.2 (CS) - October 31st 2023
Below highlights the major improvements and additions in version 4.12.2:
Layout improvements - part 2
A new UI component has been implemented for layout creation, making it easier to create layouts.The component’s interface looks similar to the Cash Flow Model, making it easier to recognize and find the rows you want to include. Also, we integrated a search function, so no need to scroll, just start typing the name of the row you want to add to your layout.
Additionally, the layout functionality was further improved by keeping row numbers intact. If you make a layout including row 2, 6 and 9, the rows will keep their original numbering instead of being given 2, 3 and 4 in the layout. This allows users to create and manage dynamic formulas while a layout is applied.
Cash flow model interface
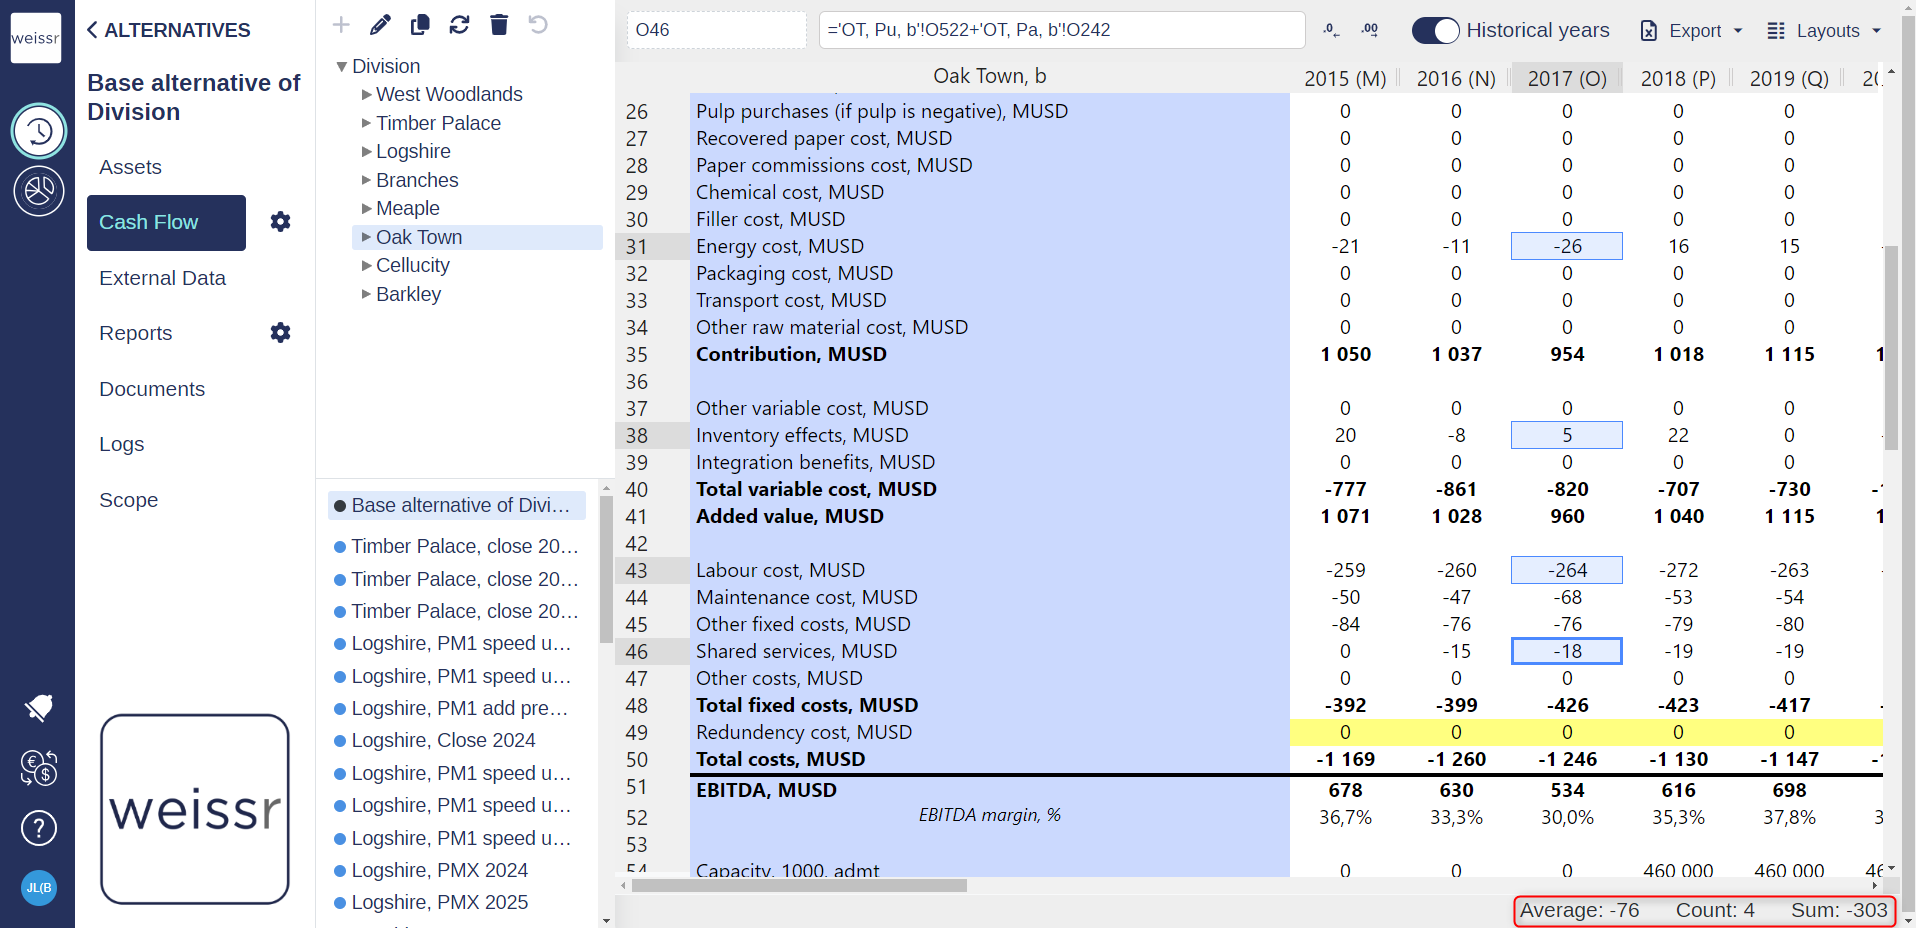
To make the cash flow model more intuitive, we implemented “on-the-fly” calculations when selecting more than one non-empty cell (sum, average and count), showing up in the bottom-right corner of the screen.
Additionally, we have also implemented CTRL-selection of cells, allowing you to select several non-adjacent cells.
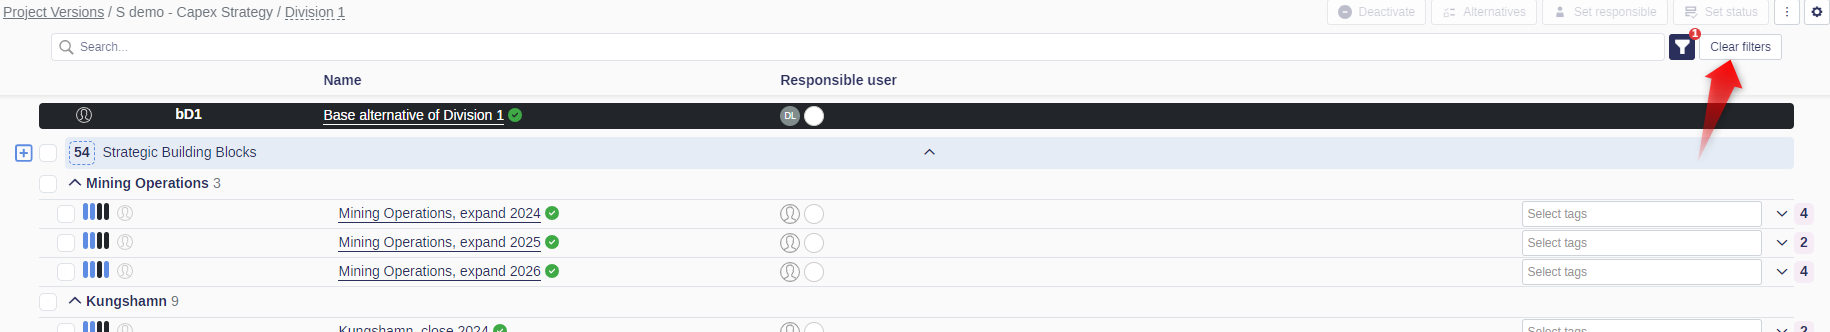
Alternative overview filtering improvement
We have now moved the “Clear filter” button to be more accessible, allowing users to quickly remove any applied filters. Once the button is visible, it will also indicate to the user that a filter is applied in the alternative overview.
Asset Mapping improvements
The filter and search functions in the Asset Mapping columns have now been extended to include all columns in Asset Mapping. Search and filter directly for names, amounts, years, even words in the description field.
Two new columns were added for better readability:
Source of creation - This column allows you to identify which assets were added on a given level.
If an asset was created in the Base Alternative, this column will be blank.
If the asset was added in a Strategic Building Block or in a Strategic Alternative, there will be the following indicators inside the column.

Source of modification - This column allows you to identify whether an asset was modified, and on which level it was last modified.
If an asset was modified in a Strategic Building Block or in a Strategic Alternative, there will be the following indicators inside the column.

You can now turn on a “delta” feature in the Asset Mapping. When turned-on, the delta-mode will show you every difference from the Base Alternative rather than absolute numbers. If you had a Base Alternative outlay of 100 that gets reduced to 80 in a building block, the delta mode will show you -20 instead.
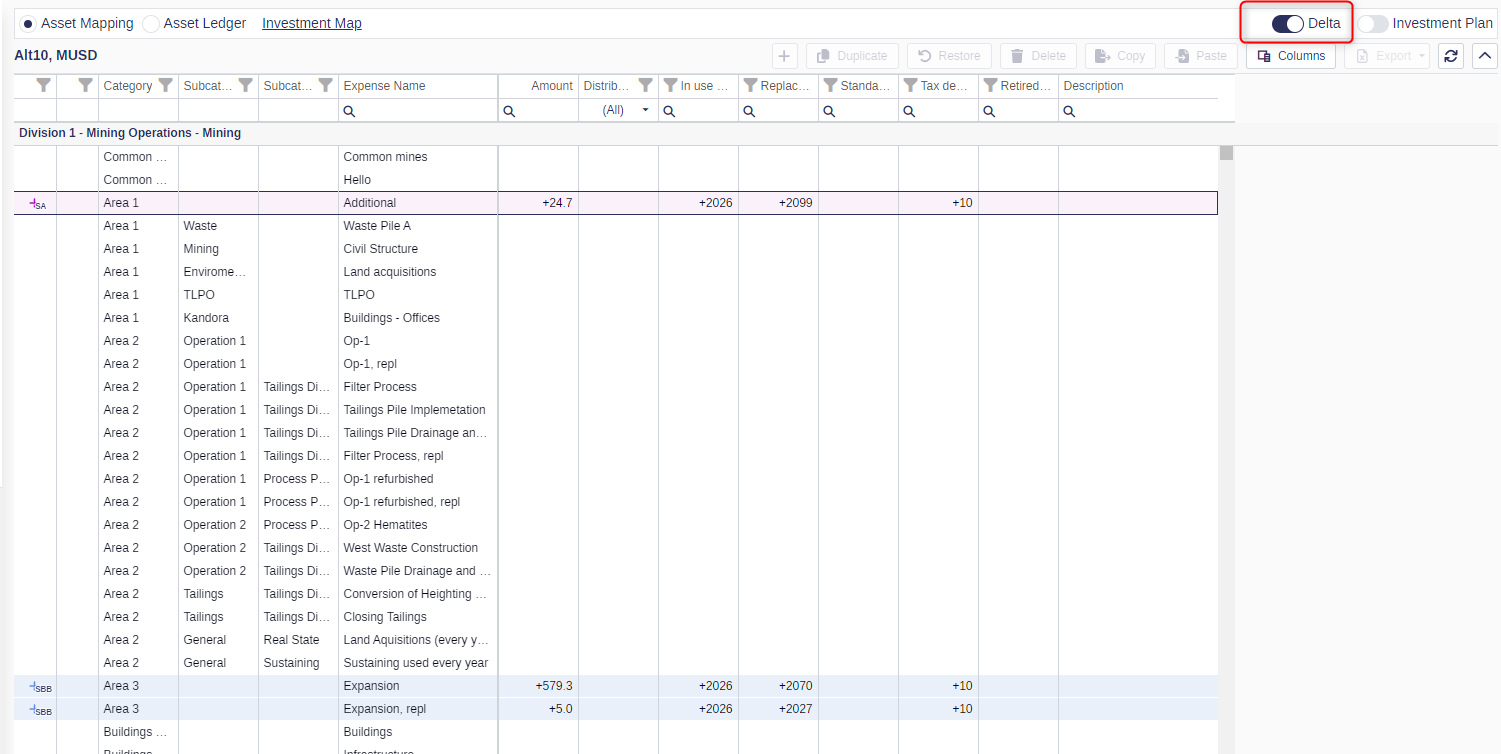
The Asset Mapping delta-mode is currently only compatible with the horizontal investment plan, not the vertical one.
It is now possible to bulk-adjust the replacement values of all assets at the same time. As time goes by, the asset valuations in real terms in Weissr get more and more outdated because of inflation. This feature intends to minimize the effort in keeping the Asset Mapping up-to-date. Managing assets in bulk is both flexible and fast, and all editions are clearly logged. From the Admin page, one can easily define a percentage replacement value should be updated by, and apply it to a selection or to all sites at once. Talk to your Success Manager for advice on how to best manage your Asset Mapping.
Presentations and reports
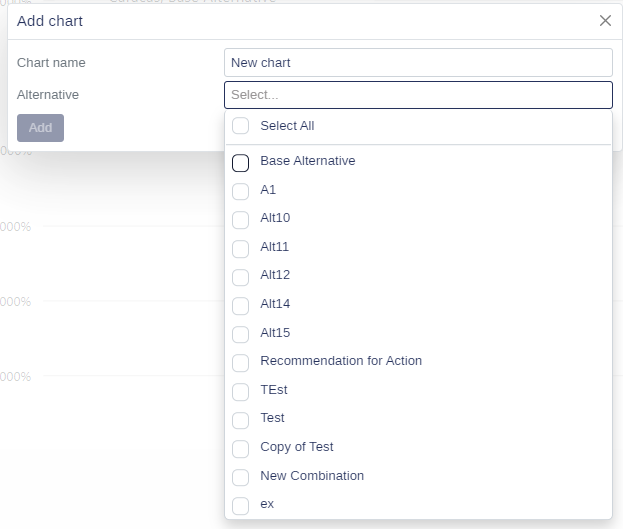
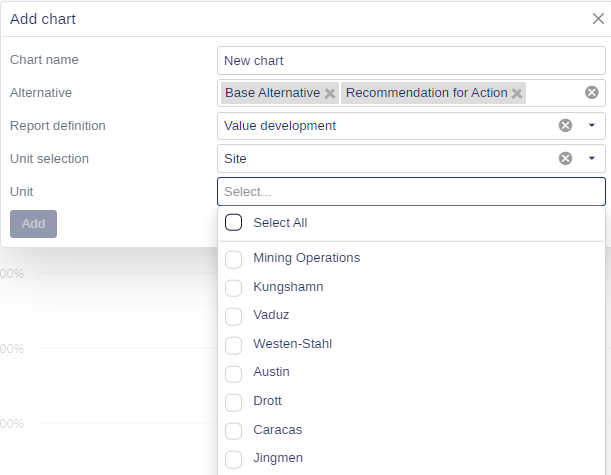
To speed up adding graphs to a presentation folder, Weissr now supports bulk addition of graphs. When you add charts inside a presentation folder, there will be an option to multi-select both which sites you want to include, but also which alternatives you want to compare inside the chart. This will greatly reduce the time needed to create a presentation since it is often the same type of chart being added, just for different sites or alternatives.
It will now be easier to find the chart you are after in the “Reports” section of your selected alternative. In larger installations with many sites, the report list can be very long, which entails a lot of scrolling and deciphering. This quality of life improvement sections this list in report types. Doing so gives better visibility, and will help you to get faster to the graph or table you’re looking for.
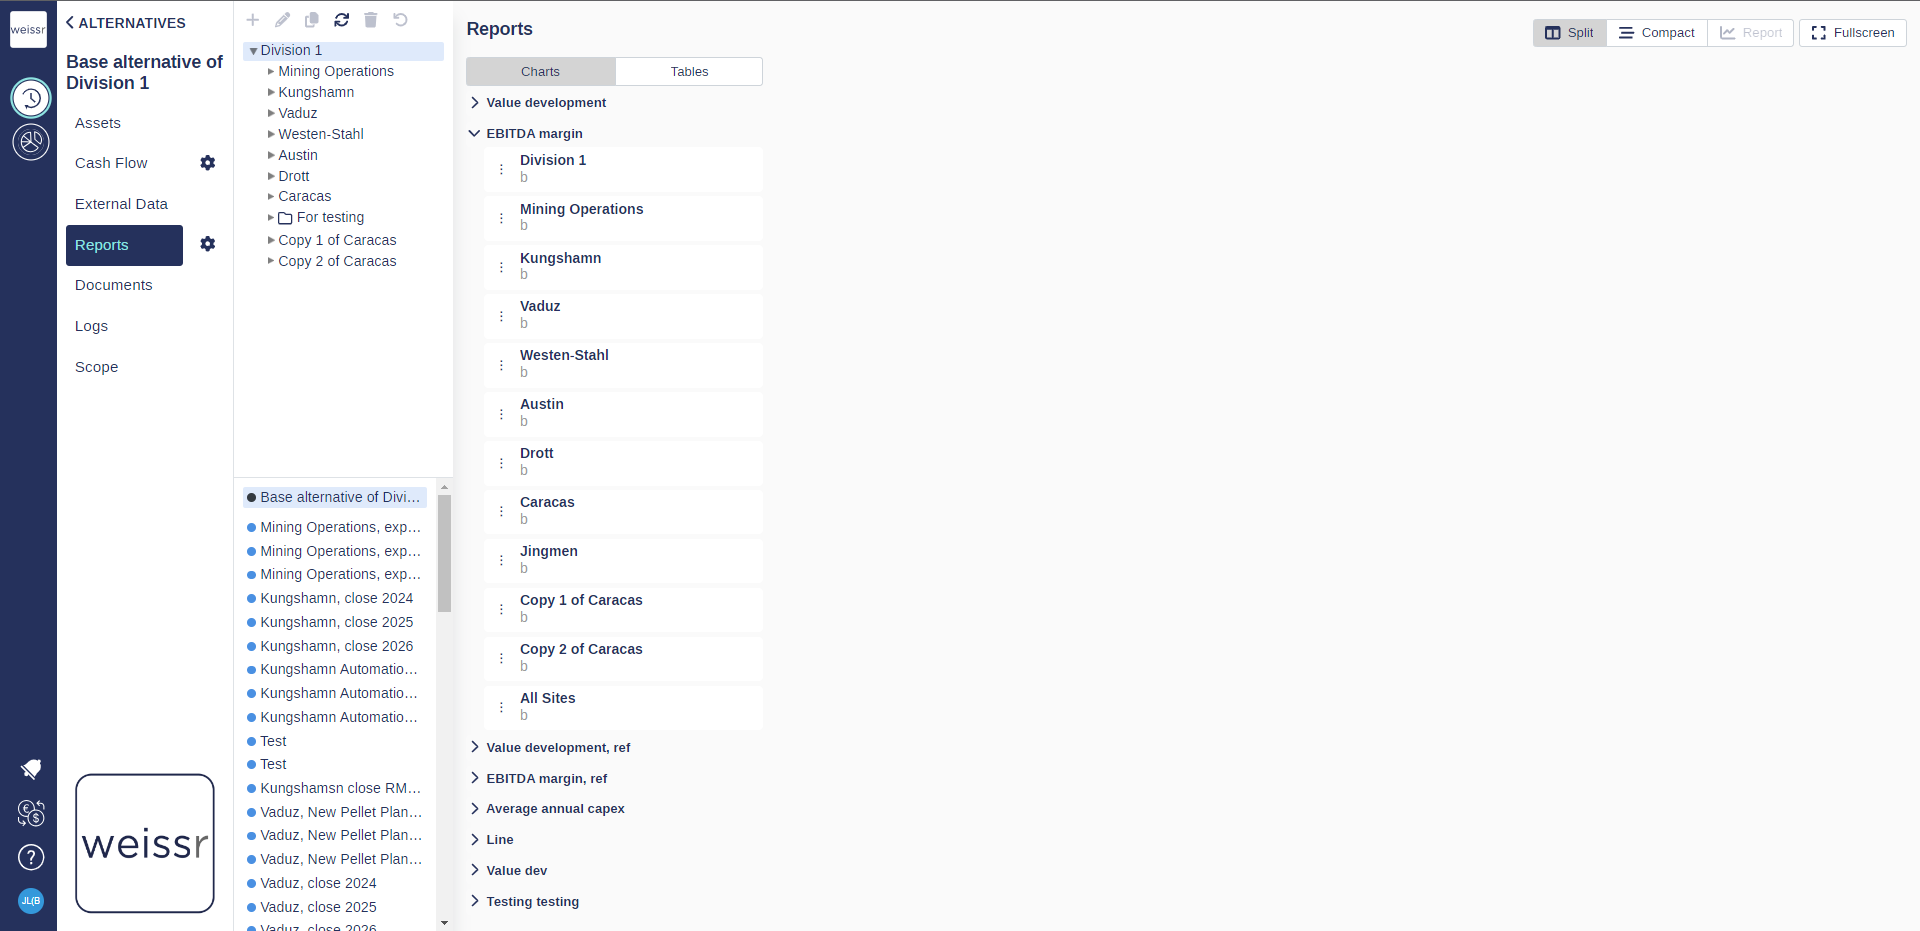
This improvement is applied to both the Charts tab and the Tables tab.
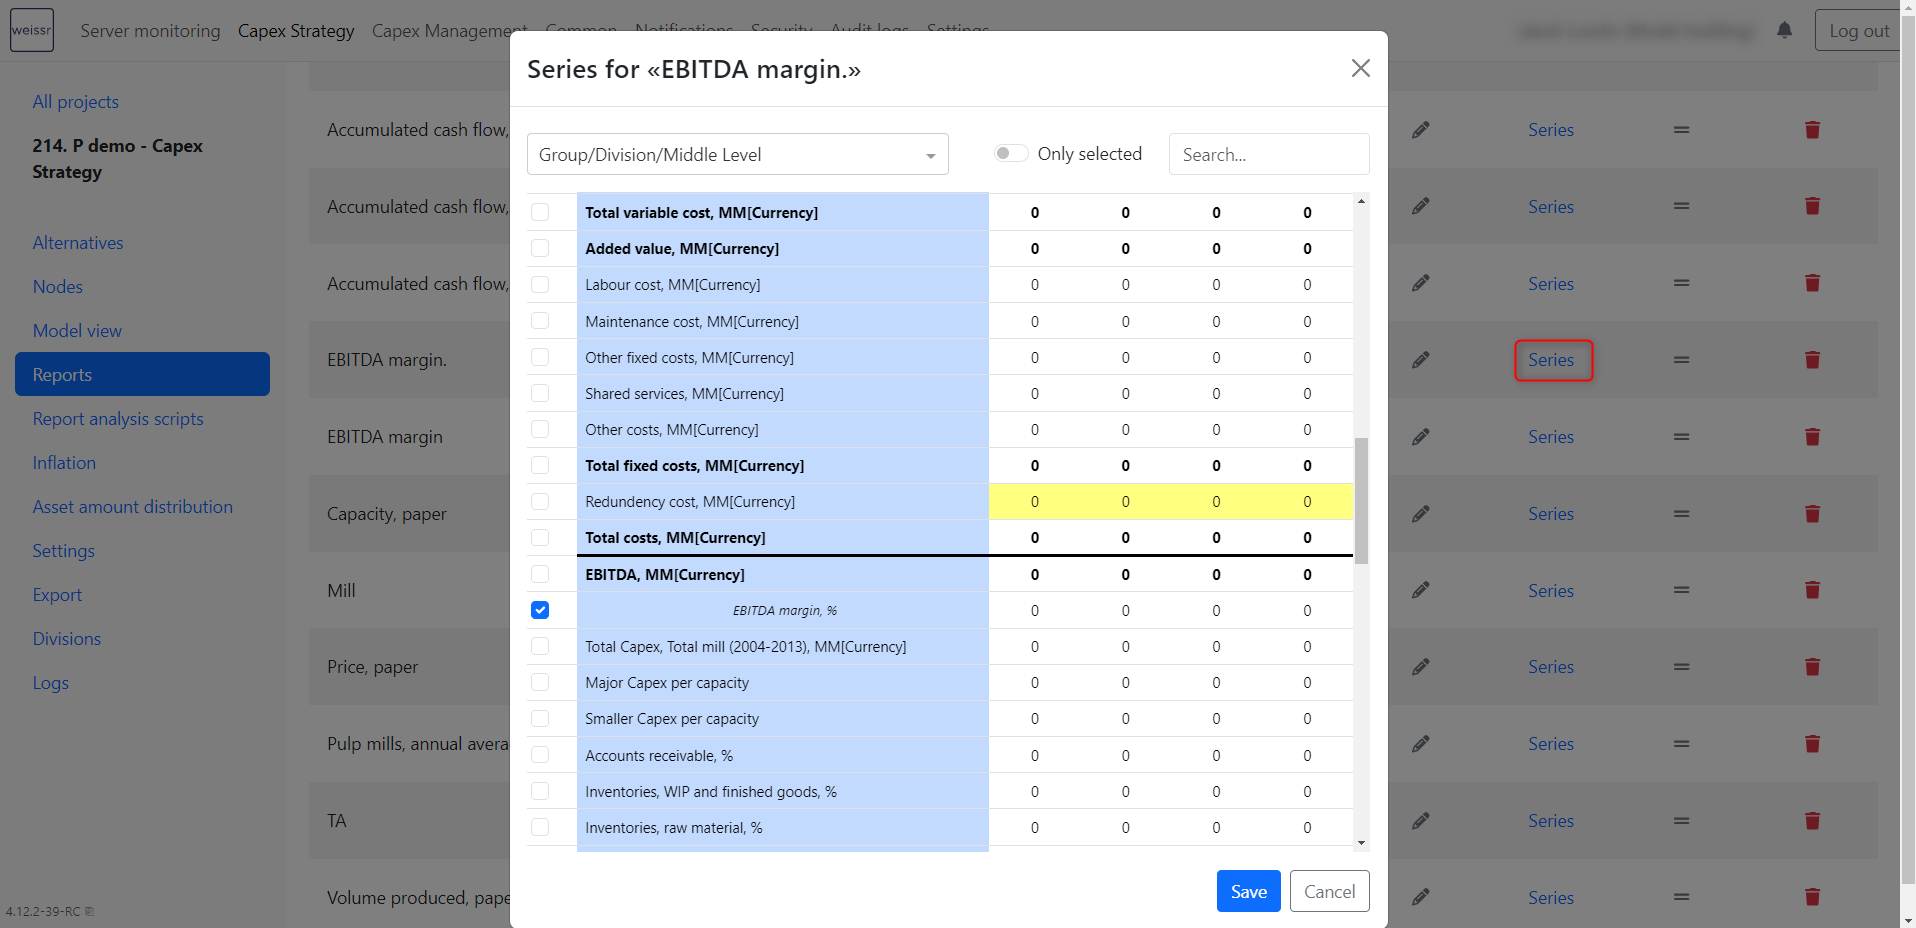
Report creation improvements
To simplify reports creation on the Admin page, there is now a new component to help your Weissr Admin to select which data point they want to create a report of. The component’s interface looks similar to the Cash Flow Model, making it easier to recognize and find the data point they are after. There is also a search function, so no need to scroll, just start typing the name of the row you want to follow in the report.
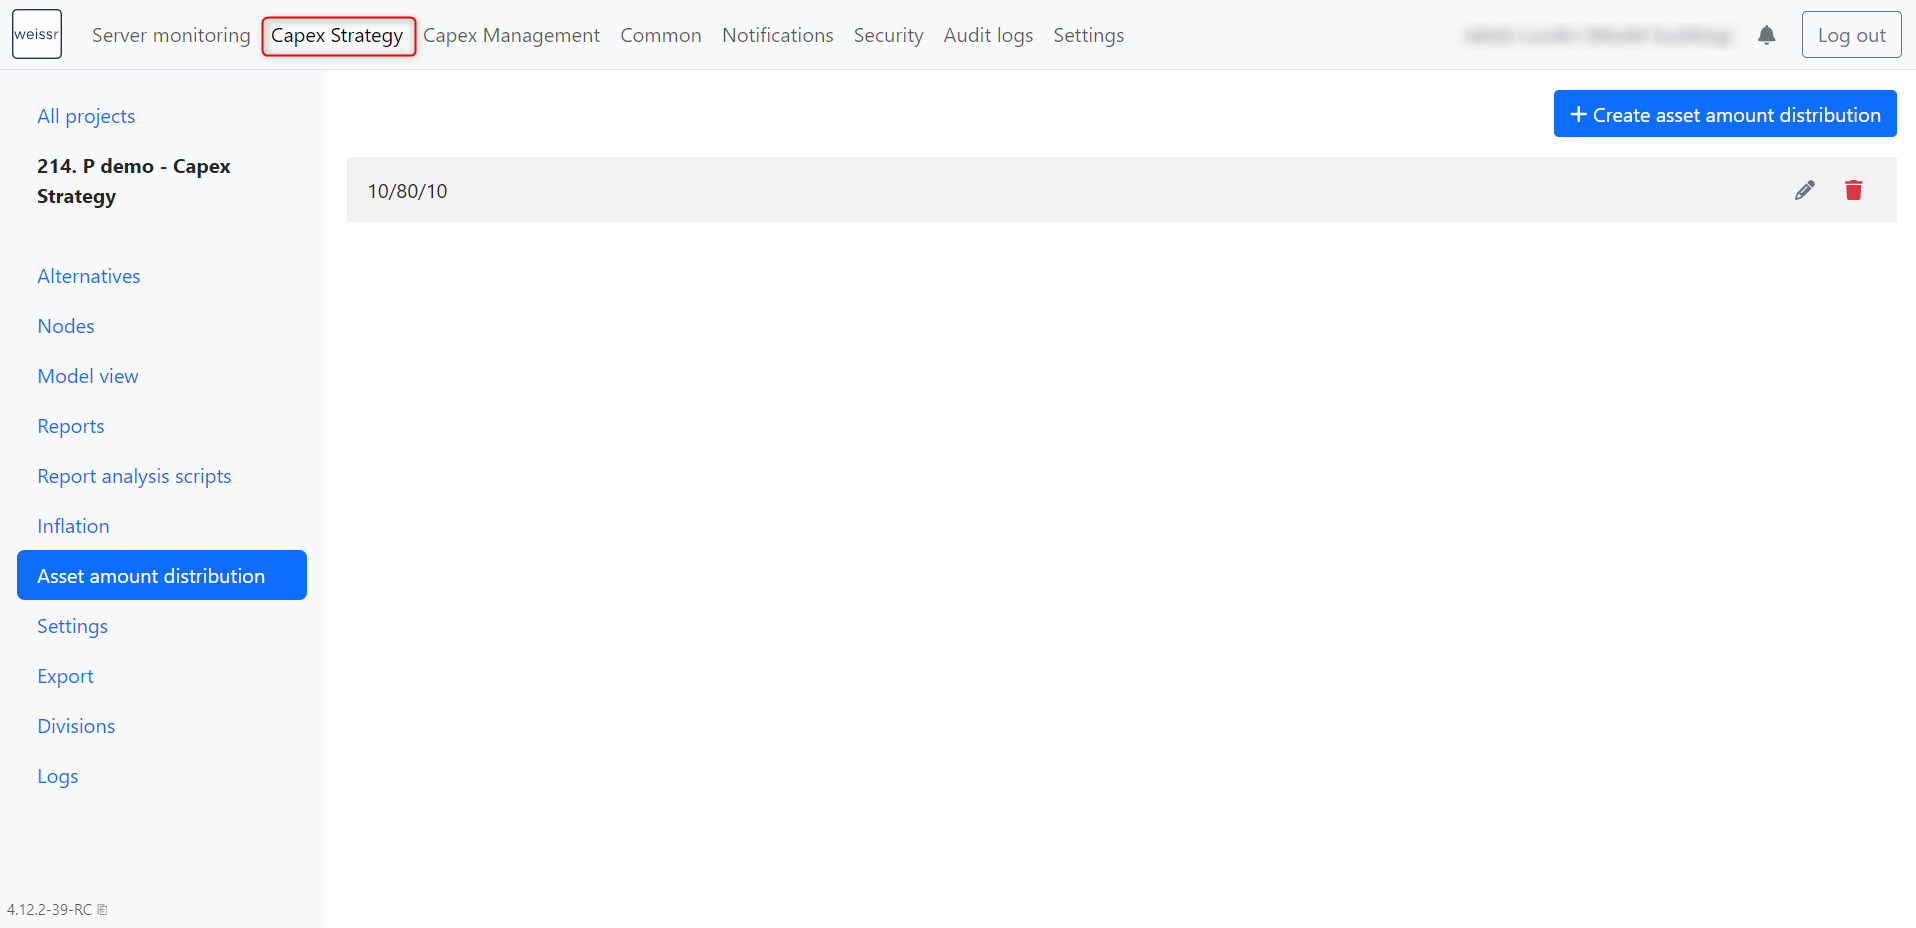
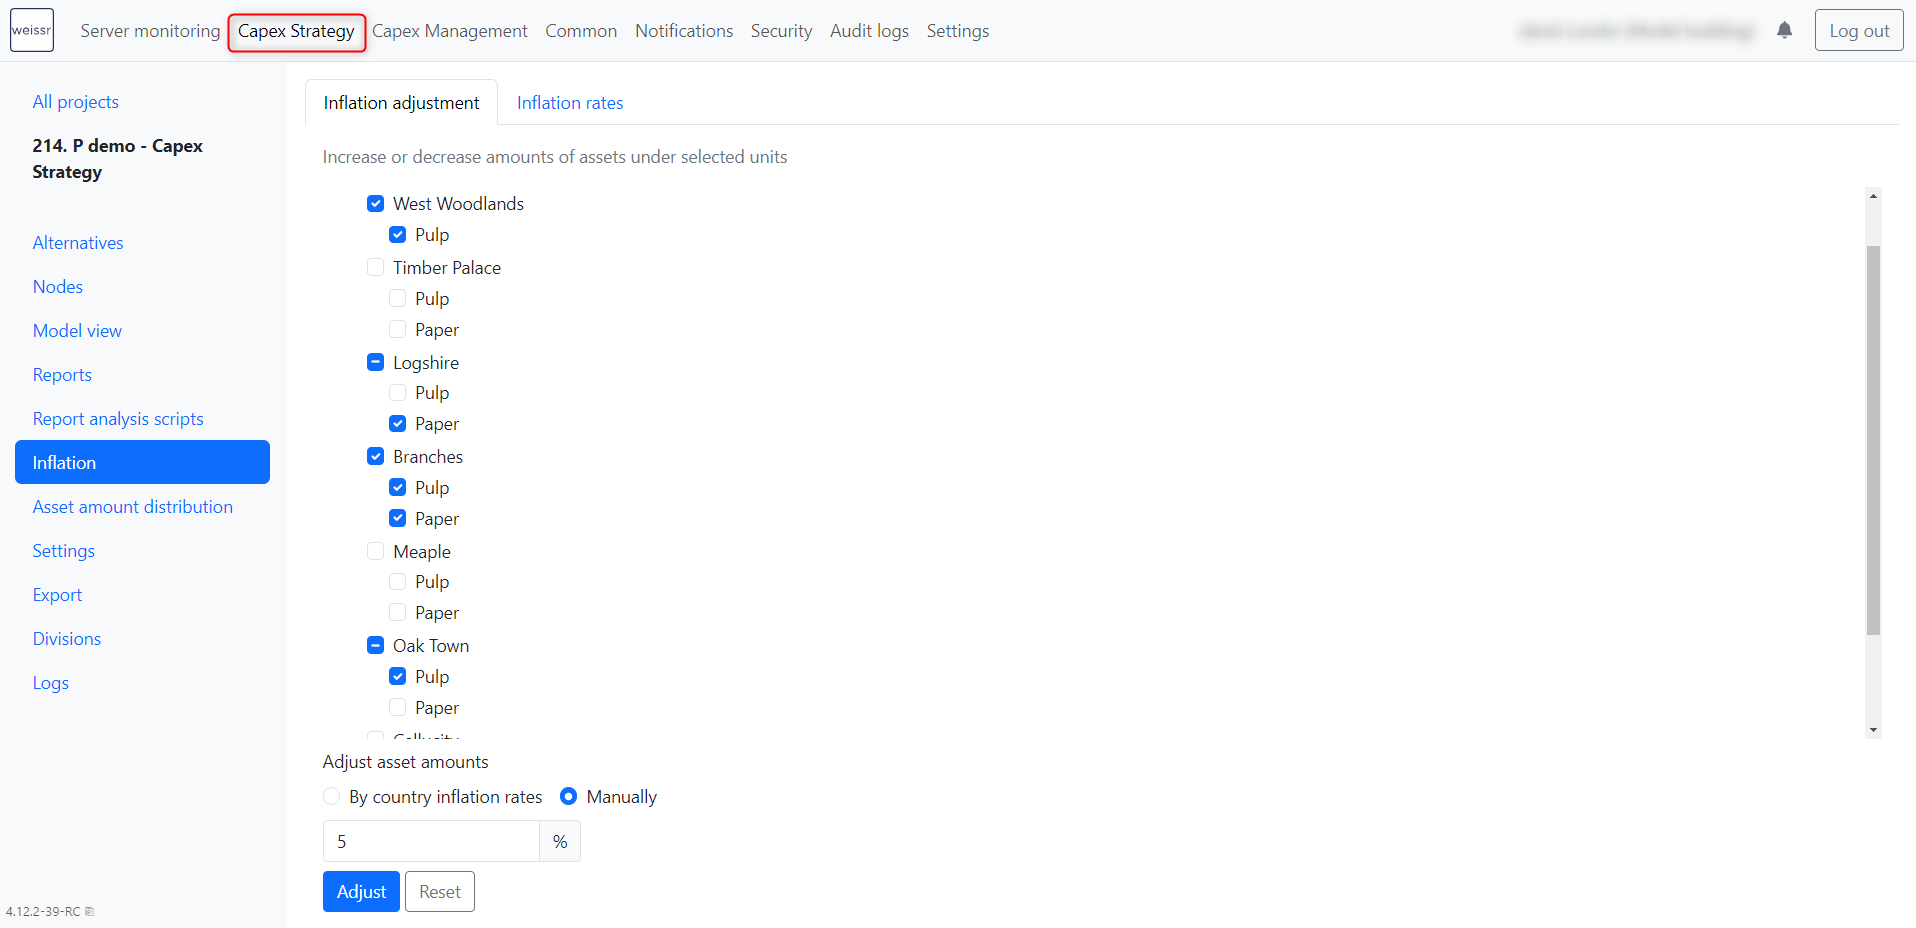
Asset Amount Distribution
Creation of custom distributions was previously only available to your Weissr contact, but now your Weissr Admin will be able to create them too. Each project can get their specific custom distributions in the “Asset amount distribution” section of the project, on the Admin page.