Investment Plan
The Investment Plan is a dynamic and visually intuitive tool designed to represent and manage investment project timelines, key decision points, and associated expenditures. Using a Gantt chart interface, it helps stakeholders visualize project progress, schedules, and milestones, while also aiding in the identification of potential delays or issues during project execution to enable timely adjustments. The Investment Plan also supports the use of multiple custom views, allowing organizations to tailor the visualization and management of project data based on different business needs, perspectives, or reporting requirements.
Investment Plan views are accessed through custom views. Default layout, resolution, and visible years can be defined by a Superuser, while users can personalize the view for their own needs.
Core Features
1. Visual Timeline Representation
The Investment Plan's Gantt chart offers an intuitive, time-based overview of project elements, including:
Requests: Submitted project initiatives under consideration.
Decision Points: Planned approvals and evaluations along the project lifecycle.
Expenditures: Forecasted and actual financial outlays over time.
The timeline helps stakeholders monitor progress, identify bottlenecks, and ensure alignment with project goals.
2. Flexible Expenditure Modes
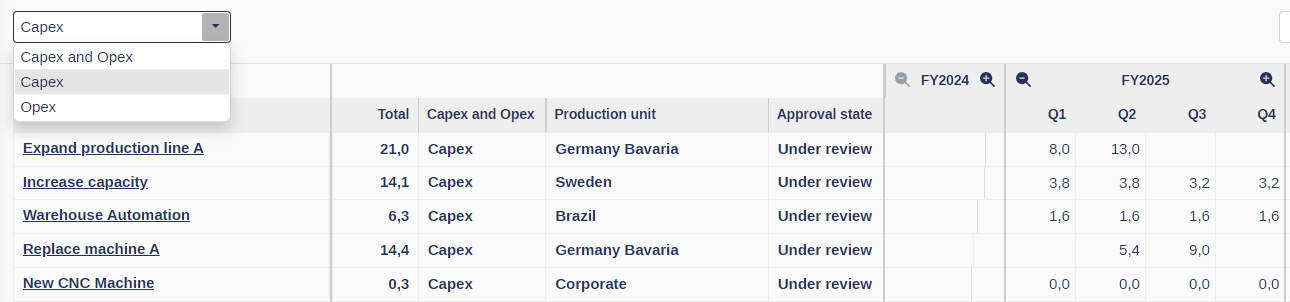
Weissr’s Investment Plan offers users the ability to view data in three expenditure modes:
Capex (Capital Expenditures)
Opex (Operational Expenditures)
Capex & Opex
Features:
Customizable Display: Select the expenditure mode from the top left corner of the Investment Plan Grid to tailor the view of project expenditures. Capex and Opex are displayed in separate rows for clarity.
Total Calculation by Mode: Totals are dynamically calculated based on the selected mode.
Column Persistence: The chosen expenditure mode is saved per user settings and persists across sessions.
The selected expenditure mode is saved per user and per view.
3. Pre-defined time Resolution Options
Users can adjust the time resolution in the Investment Plan grid to suit their data analysis needs. Available resolutions include:
Monthly
Quarterly
Annual
Key Features:
Investment Plan Settings: The Investment Plan settings are defined by administrators, including the last available year and standard resolution settings. Refer to the Investment Plan Configuration documentation for detailed information on customizing the Investment Plan.
Resolution Flexibility: The standard resolution settings relate to the current year, such as:
Monthly: Current year
Quarterly: Next year
Annual: Remaining years
Magnifying Glass Controls: Zoom in or out for each year directly from the grid:
Zoom In to switch from annual to quarterly or from quarterly to monthly.
Zoom Out to simplify data presentation.
Resolution settings can be saved per user and per view when using manual configuration.
4. Manually customize outlay years
Users can control which years are displayed in the Investment Plan.
Click Outlay years
Select specific years to display
Only selected years are shown in the grid.
Resolution modes
The Investment Plan supports two modes:
Automatic – system-defined resolution
Manual – user-defined years and resolution
Manual mode overrides the default configuration.
Reset to default
Use Reset to restore default years and resolution
Returns to Pre-defined time Resolution configuration.
5. Split-Screen Editing
The split-screen editing feature allows users to edit Request expenditures directly from the Investment Plan grid to simplify navigation.
How Split-Screen Editing Works
Activation:
Double-click on a Request Outlay to open the split-screen editor.
The Expenditure grid opens in a split-screen view, occupying up to 50% of the screen space.
Visual Indicators:
The selected Request is highlighted in grey.
A link to the Request is available.
The current user locks the Request.
Note: If the Request is already locked by another user, the Expenditure grid will indicate this and prevent edits.
Expenditure Grid Details:
Pre-decision Outlays: Editable for Draft, Under Review, and Decision Requests.
Post-decision Outlays: Editable for Monitoring; non-editable for Follow-up, Completed, and Rejected Requests.
Post-decision Requests do not display pre-decision data.
Edit Rules:
Editing permissions align with Request rules:
Project (CM) Edit Permission for the Site of the Request
OR Contribution Access via User Properties
Navigation and Persistence
Double-clicking on another Request Outlay closes the current Expenditure grid and opens the grid for the newly selected Request.
The split-screen editor remains active across page filters and navigation:
If the filter hides the selected Request, the editor stays active.
When filters are removed, or the user returns to the page, the editor reactivates for the same Request.
6. Resizable Sections
The Investment Plan grid is divided into three resizable sections to keep data accessible and organized:
Request Name: Displays the title of the investment request.
Fields: Displays key project details, including customizable fields.
Outlays: Shows planned and actual expenditures.
Key Features:
Independent Scrolling: Scroll horizontally within the Fields or Outlays sections without affecting others.
Drag-to-Resize: Adjust section sizes by dragging section borders for better visibility of critical data.
7. Unlimited Fields
The Fields section supports unlimited data fields, making it adaptable to any project.
Highlights:
Custom Field Order: Reorganize visible fields to suit your analysis needs.
Frozen Headers: Column headers stay visible during vertical scrolling for better context.
Independent Horizontal Scrolling: Analyze data seamlessly across multiple parameters.
Always-Visible Fields:
To ensure critical information is always accessible, the following fields are permanently visible and cannot be hidden or removed:
Project Name
Expenditure Type
Total Amount
While these essential fields remain fixed, users can still add and organize additional fields to tailor the grid to their specific requirements, enhancing data visibility and usability.
Field selection can also be controlled using layouts.
8. Flexible Data Organization
Tailor the Investment Plan layout for your needs:
Drag-and-Drop Columns: Reorder columns by dragging and dropping headers.
Adjustable Column Widths: Resize columns by dragging the edges of column headers to optimize readability, especially for lengthy field names.
Drag year column headers to adjust width
Quarter and month columns adjust proportionally
Column widths are saved per user and per view.
These tools ensure the grid adapts to your specific use cases.
9. Layouts
You can apply predefined layouts in the Investment Plan.
Layouts define visible fields and their order
The same layouts are available as in Power Mode
Applying a layout updates the view instantly.
The selected layout is saved per user.
10. Collapsible Decision Steps
The Decision Steps section is collapsible, allowing users to:
Optimize screen space.
Focus on project data while accessing decision details only when needed.
Easily expand or collapse this section to adjust your view.
Benefits
Enhanced Tracking: Keep timelines, decision points, and expenditures on track.
Flexible Data Management: Customize layouts, expenditure modes, and resolutions to match your requirements.
Simplified Editing: Streamline expenditure updates with split-screen editing directly from the grid.
Improved Accuracy: Quickly identify potential delays or risks for proactive intervention.
How to Use the Investment Plan
Navigating the Grid
Open a custom view based on Investment Plan from the navigation panel.
Scroll horizontally within the Fields and Outlays sections as needed.
Tip: Hold the Shift key and use your mouse to scroll horizontally faster.
Customizing the Layout
Drag column headers to reorder fields.
Resize columns or sections by dragging the edges of headers or section borders.
Expand or collapse the Decision Steps section for a tailored view.
Adjusting Time Resolution
Use magnifying glasses in the grid to zoom in or out on specific years.
Select between Monthly, Quarterly, or Annual resolutions based on your needs.
Editing Expenditures via Split-Screen
Double-click a Request Outlay to edit expenditures directly in the split-screen view.
Use the grid to modify pre-decision or post-decision data according to permissions.
Saving Your Preferences
The following settings are saved per user and per view:
Visible fields and layout
Section sizes
Expenditure mode
Selected outlay years
Resolution mode
Column widths
Your configuration is automatically applied when you return to the view.