Version 5.2 (CM) August 4th 2025
Stay up to date with the latest enhancements and new features in Weissr Capex Management and Capital Budgeting. This page highlights what’s new in this release so you can get the most out of your Weissr experience.
Weissr Capex Management
New expenditure grid
The updated expenditure grid offers a more intuitive and efficient experience for planning, entering, and managing financial data related to both capex and opex. With enhanced layout controls, improved navigation, and clearer in-grid interactions, it's easier than ever to work with detailed expenditure data.
📍 What’s new
Improved grid interaction
Smoother row highlights and clearer hover states make navigating the grid more intuitive.Editable fields clearly marked
Editable cells now show a ✏️ pencil icon and a subtle highlight on hover, making them easy to identify.Field descriptions on hover
Hover over any column header to view a brief explanation of the field’s purpose.Required field prompts
You'll be alerted if any required fields (system or organization-defined) are missing from your view when creating a new expenditure line item.Flexible outlay planning
View and manage outlay data by year, quarter, or month. Use the Outlay years button to customize the timeline shown.Customizable layout
Pin, reorder, and resize columns (left, right, or sticky) to suit your workflow. Layout preferences are saved per user and request.Smarter sorting, grouping, and search
Organize large data sets with multi-column sorting, drag-and-drop grouping, and free-text search.Reset layout
Quickly return to your organization's default grid layout using the Reset layout option in the toolbar.Adaptive toolbar
The toolbar adapts based on screen size and user selection, keeping key actions accessible at all times.
👉 Learn more about using the new expenditure grid
👉 Learn more about configuring the default expenditure grid layout as an administrator
Improved visibility into period spend and commitment details
We’ve made enhancements to the grids that display actual period spend and committed amounts linked to expenditure line items, making it easier to analyze financial data in detail.
📍 What’s new
Quick access to detailed data
Select one or more expenditure line items in the post-decision grid, then click the Transactional data or Commitments button to view detailed breakdowns.User-defined decimal delimiters
The pop-up grids now apply your preferred decimal delimiter format to the amount field, making figures easier to read and interpret.Total row
A new total row at the bottom of the grid shows the sum of all displayed items, based on your current filter or search. This helps you quickly understand total period spend or committed amounts across selected line items.
Depreciation settings from yearly to monthly
Admins can now configure depreciation to better reflect the actual usage period of an asset by selecting between yearly or monthly calculation methods. Weissr Capex Management uses the straight-line depreciation method to ensure consistent and transparent financial reporting. This improvement helps ensure that depreciation values better reflect the true usage period of each asset.
👉 Learn how to apply annual or monthly depreciation method as an administrator
Forecast delta adjustment for financial period management
A new feature, Forecast delta adjustment, is now available for organizations using financial period management. This helps reduce the manual effort of updating forecasts at each period closure by automatically managing forecast differences.
You can now configure:
Whether forecast delta adjustments are enabled or disabled for each period group
Where the delta should be applied: in the next open period or the last period of the fiscal year
Whether to aggregate all forecast deltas into a single expenditure line or using the individual expenditure lines, simplifying tracking and making adjustments more transparent
These options provide more control, consistency, and automation, saving time and improving forecasting accuracy across period groups.
👉 Learn how to enable and use forecast delta adjustment during period closure
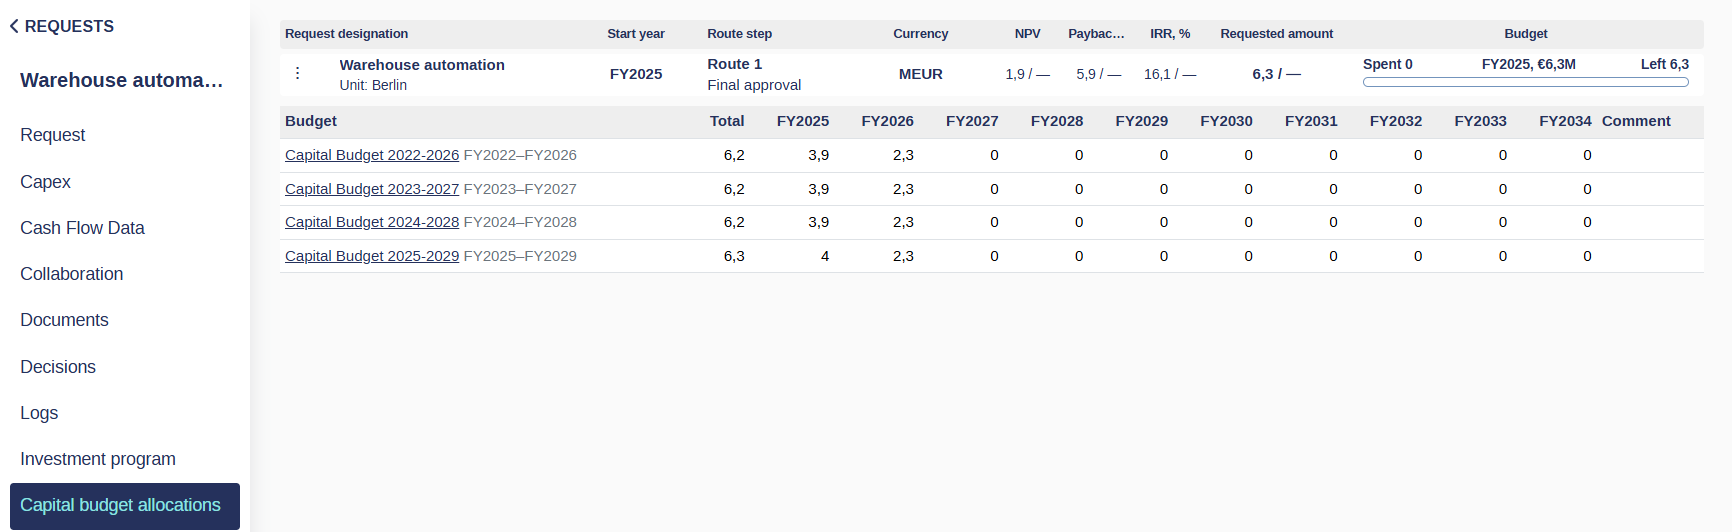
View project allocations across capital budgets in a new menu item: Capital budget allocations
To improve clarity around budgeted amounts for projects included in capital budgets, we’ve introduced a new menu item in the Capex request view: Capital budget allocations.
Previously, the budgeted row was shown directly in the expenditure grid, but it wasn’t always clear how that related to the broader capital budget. This new section makes it easier to distinguish between:
The approved and budgeted amount for the individual project, and
The budget allocation from one or more capital budgets.
📍 What’s new
A new menu item—Capital budget allocations—is now available in projects.
This menu will appear only for projects included in at least one capital budget.
You’ll see a list of all capital budgets that the project is part of, along with the budgeted amount in each.
Improved editing experience in Power mode
We've rolled out enhancements to Power mode that make editing faster, cleaner, and more intuitive, without compromising on data integrity. These updates reduce visual clutter, improve navigation, and make Power mode feel faster and more polished.
A cleaner, more responsive grid
We’ve made UI refinements that improve how the grid looks and behaves in Power mode. These changes make it easier to focus on your data and streamline interactions.
📍 What’s new
Zebra striping removed for a cleaner layout
Bold headers with grey backgrounds improve visual structure
Field descriptions are now clearly visible on hover, making it easier to understand what each field is for without extra clicks.
Smooth row highlights on hover
Editable cells are clearly indicated on hover, including a ✏️ pen icon
Smoother editing with fewer interruptions
We’ve made inline editing in Power mode faster and more flexible!
Previously, you couldn’t save updates unless all required fields in the view were filled, even if you only needed to change one value. Now:
📍 What’s new
Edit and save individual fields without needing to complete all required fields in the view.
Dropdown options now automatically open when tabbing to the next editable cell, making edits even smoother.
🔒 Required fields are still enforced when a request progresses through its workflow routes, ensuring business rules remain intact.
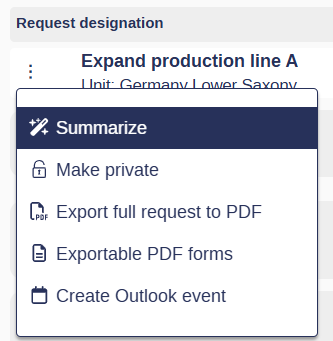
AI Summary for requests
Quickly get an AI-generated overview of any request without scrolling through multiple forms. The summary is created in real time using only the data you have permission to view and is not stored after closing.
📍 What’s new
Generate a one-click AI summary from the request’s context menu
Includes request properties, expenditure details, outlay data, decision information, and linked requests
Excludes images, collaboration data, logs, and model data
Summary text is pre-prompted using a system prompt defined by your administrator
Appears in a pop-up window and can be copied for sharing or reporting
New in-app chatbot
We’ve introduced a new chatbot powered by the OpenAI GPT-4 model. The chatbot can answer general questions, assist you with product features, and maintain context within a single conversation. It does not have access to the internet or live search results, and for privacy, it does not remember any information once your session ends.

Changes to property settings
New expenditure type properties cannot currently be used in data transfer between two servers.
Improved control over property codes
Admins now have full control over property codes used across the system, helping standardize data and prepare for future automation.
📍 What’s new
The code is now a required field when creating or editing properties.
Only alphanumeric characters and underscores are allowed. This helps keep naming conventions clean and integration-friendly.
Available for both dynamic and static properties.
Existing properties are auto-assigned a code
Possible to use expenditure properties in relation chains to improve the editing experience
You can now create property relations for expenditure fields, enabling a more guided and streamlined data entry experience.
📍 What’s new
Admins can define relations between expenditure properties, similar to how request property relations work.
This ensures users only see relevant options based on previously selected values.
Reduces input errors, speeds up data entry, and improves consistency in expenditure planning.
👉 Learn more about configuring expenditure property relations
Default property values on request & expenditure creation
Admins can now set default values for most request and expenditure properties — not just code-type fields!
Supported field types include text, numbers, money, booleans, and dates.
Defaults can be:
A constant value
Pulled from another property (e.g., inherited from the parent capex request)
This update reduces manual entry, improves consistency, and accelerates the creation process.
👉 Learn how to configure default values here
Changing the display name for global properties used in the expenditure grid
You can now customize the display name of global properties specifically for the expenditure grid, without affecting how they appear on request forms.
This is especially useful when the same property needs to be labeled differently depending on the context.
📍 What’s new
Global properties now support a separate display name for the expenditure grid.
This lets you tailor labels to match how users interact with expenditure data, while keeping form labels consistent.
👉 Learn how to configure custom display names for global properties
More control and flexibility for expenditure categories
Managing expenditure categories (Property ID 87) is now easier and more flexible!
You can:
Create and edit categories directly from the property settings.
Deactivate outdated categories without losing historical data.
Keep your active selection lists clean while maintaining audit trails.
If a category hasn’t been used, you can delete it. If it has been used, it’s inactivated automatically.
👉 Learn more about managing expenditure categories here
Reporting data export changes
We’ve made several enhancements to the cm_capex table and reporting data exports to better support customers using the Spend to Cash feature (which includes accrual-based expenditures). These updates help provide a unified view of both accrual-focused and cash-focused expenditure data, right within the Weissr reporting database.
Schema changes to cm_capex table
We’ve added and updated several columns to enrich expenditure data:
New column
expenditureFocus– Distinguishes betweenaccrualandcashentries.New column
paymentTerm– Populated for both accrual and cash entries. For all organizations not using accrual and cash expenditure reporting, this column will display no values.New column
expenseType– Provides information on whether the expenditures are of type Opex or Capex.The column
taxDepreciationhas been renamed tousefulLife.
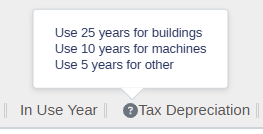
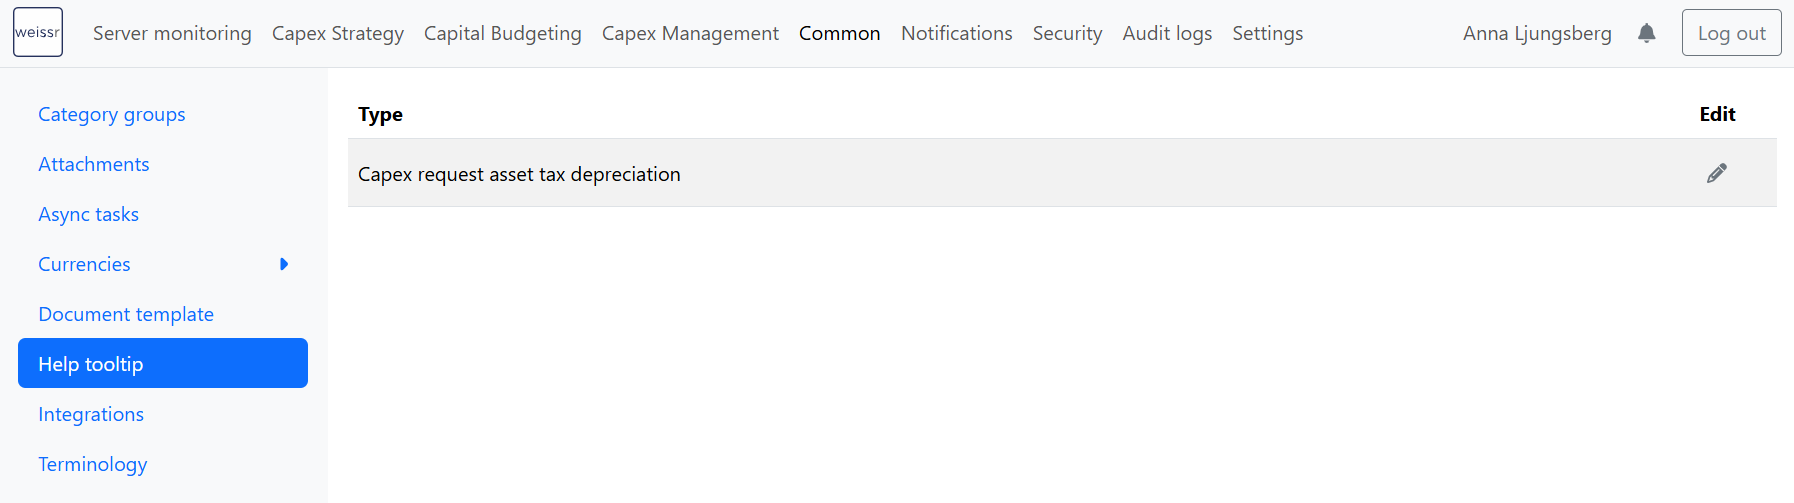
Removal of the Help tooltip in administration
In version 5.2, the help tooltip for the Tax Depreciation field in Administration → Common has been removed. Previously, the help tooltip was shown when hovering over this field in the expenditure grid. Now this information can be added to the description of the Useful Life property (also known as Tax Depreciation, ID 88). This update ensures that attribute descriptions are managed in a single, consistent location.