Capital Budgeting Charts
Administrators can enable system-generated charts and configure custom charts to visualize capital budgeting data. These charts help track budget status, spending distribution, and request amounts across different properties.
Charts configured for capital budgets will be available in all capital budgets, ensuring consistency across the organization.
Accessing Chart Configuration
Navigate to Administration → Capital Budgeting → Charts to configure system and custom charts.
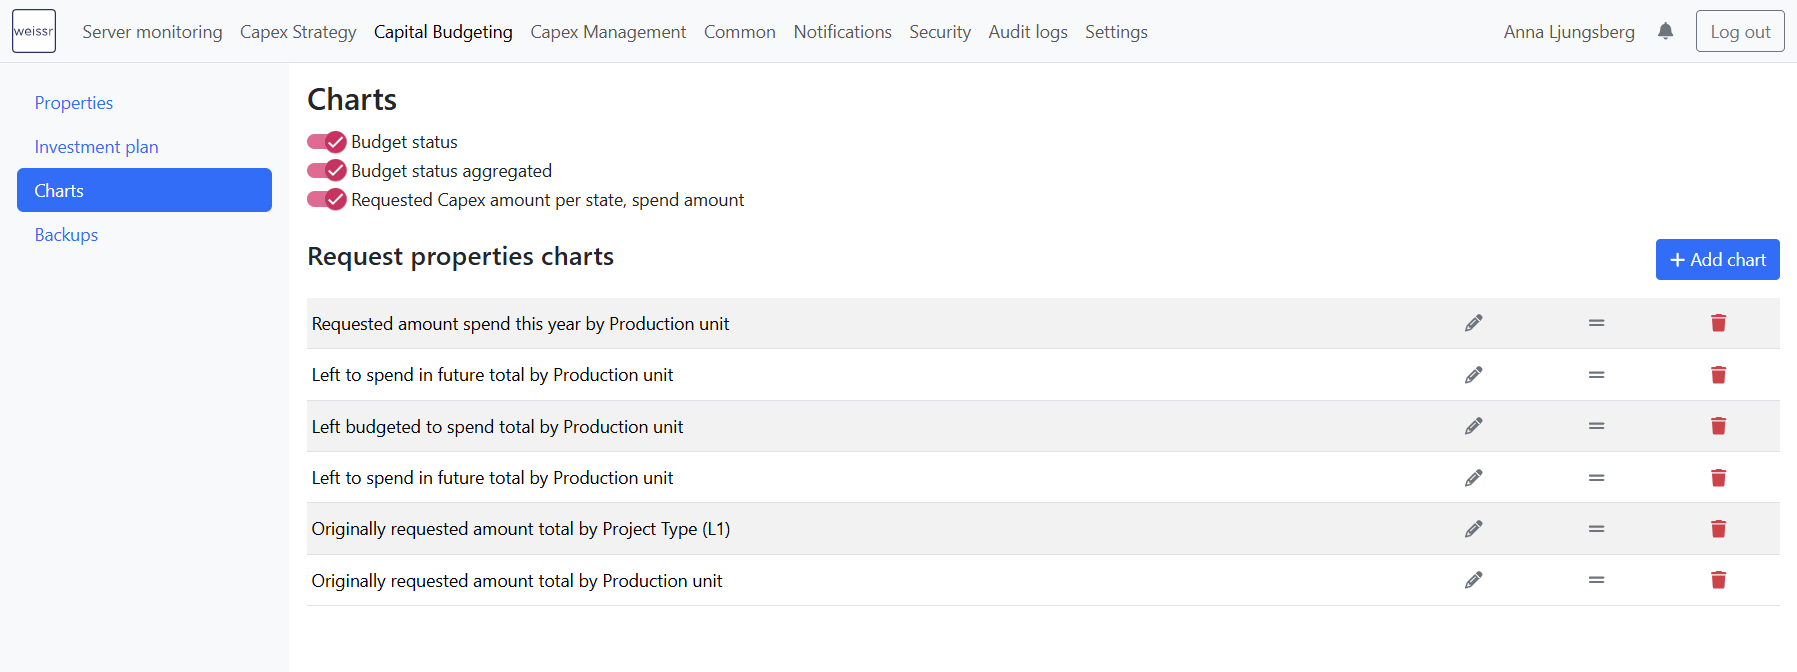
System Charts
Weissr Capital Budget includes three predefined system charts that can be enabled using toggles:
Budget Status – A bar chart displaying budgeted vs. actual spending for CAPEX and OPEX across different production units.
Budget Status Aggregated – Similar to Budget Status but aggregates CAPEX and OPEX data across all production units.
Requested Capex Amount per State, Spend Amount – Breaks down requested capital expenditure amounts by state and spending category.
System charts dynamically adjust based on the selected Focus in the budget (Decision or Spend). For more details, refer to the Capital Budget Overview documentation.
Custom Charts – Request Properties Charts
Administrators can define additional charts based on request property data. Two chart types are available:
Number of Requests by Property – Counts the number of requests based on a selected property.
Amounts by Property – Sums request amounts based on a selected property.
Supported Chart Types for Custom Charts
Custom charts can be displayed using the following formats:
Bar Chart
Donut Chart
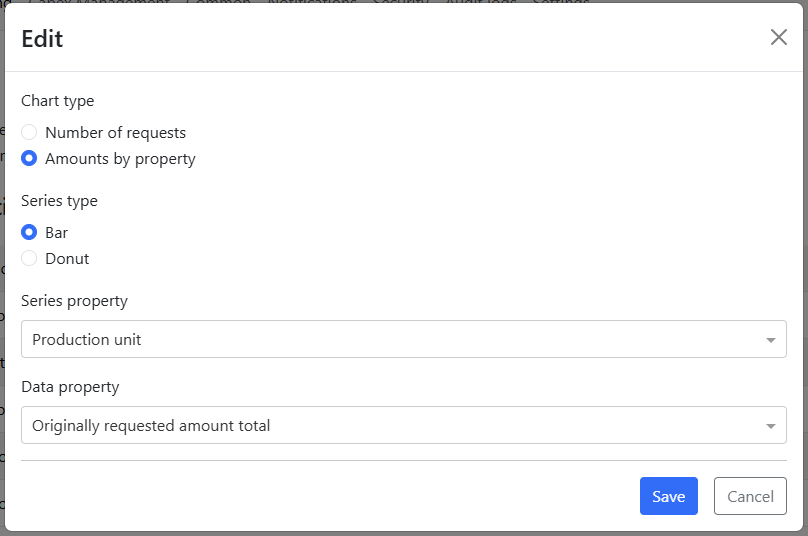
Configuring "Amounts by Property" Charts
When creating an Amounts by Property chart, administrators must define:
Series Property – The category used for grouping data.
Data Property – The numerical property used to calculate amounts.
The Data Property field only supports the following property types:
Integer
Decimal
Money
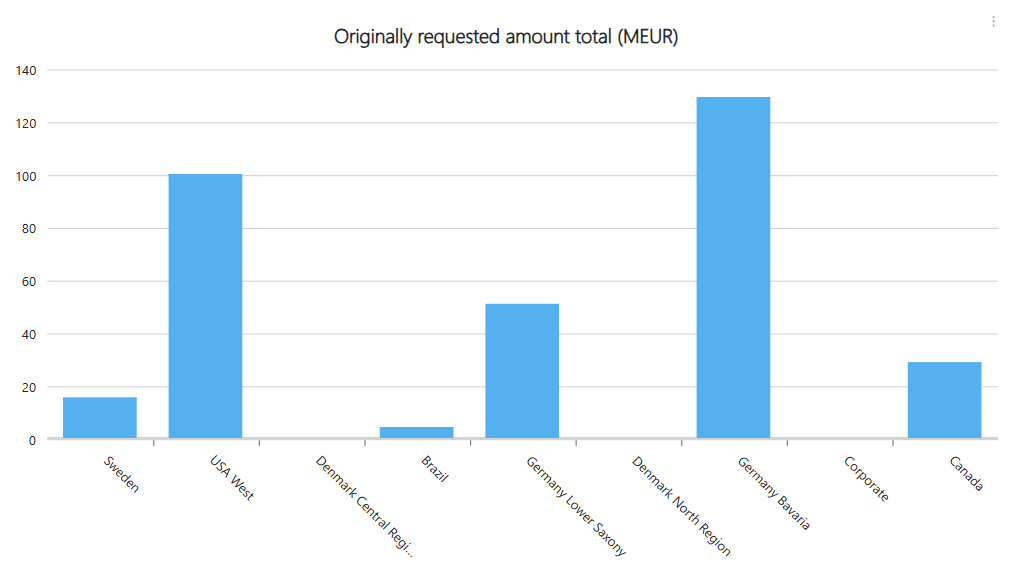
Example "Amounts by Property" Charts
Managing Custom Charts
To manage or create custom charts:
Navigate to Administration → Capital Budgeting → Charts.
Click the pen icon to edit an existing chart or click +Add Chart to create a new one.
In the chart configuration pop-up:
Select either Number of Requests by Property or Amounts by Property.
Choose a Series Type (Bar or Donut).
If using Amounts by Property, define the Series Property and Data Property.
Save the configuration.
Adjusting Chart Display Order
The order of custom charts can be changed by drag-and-drop.