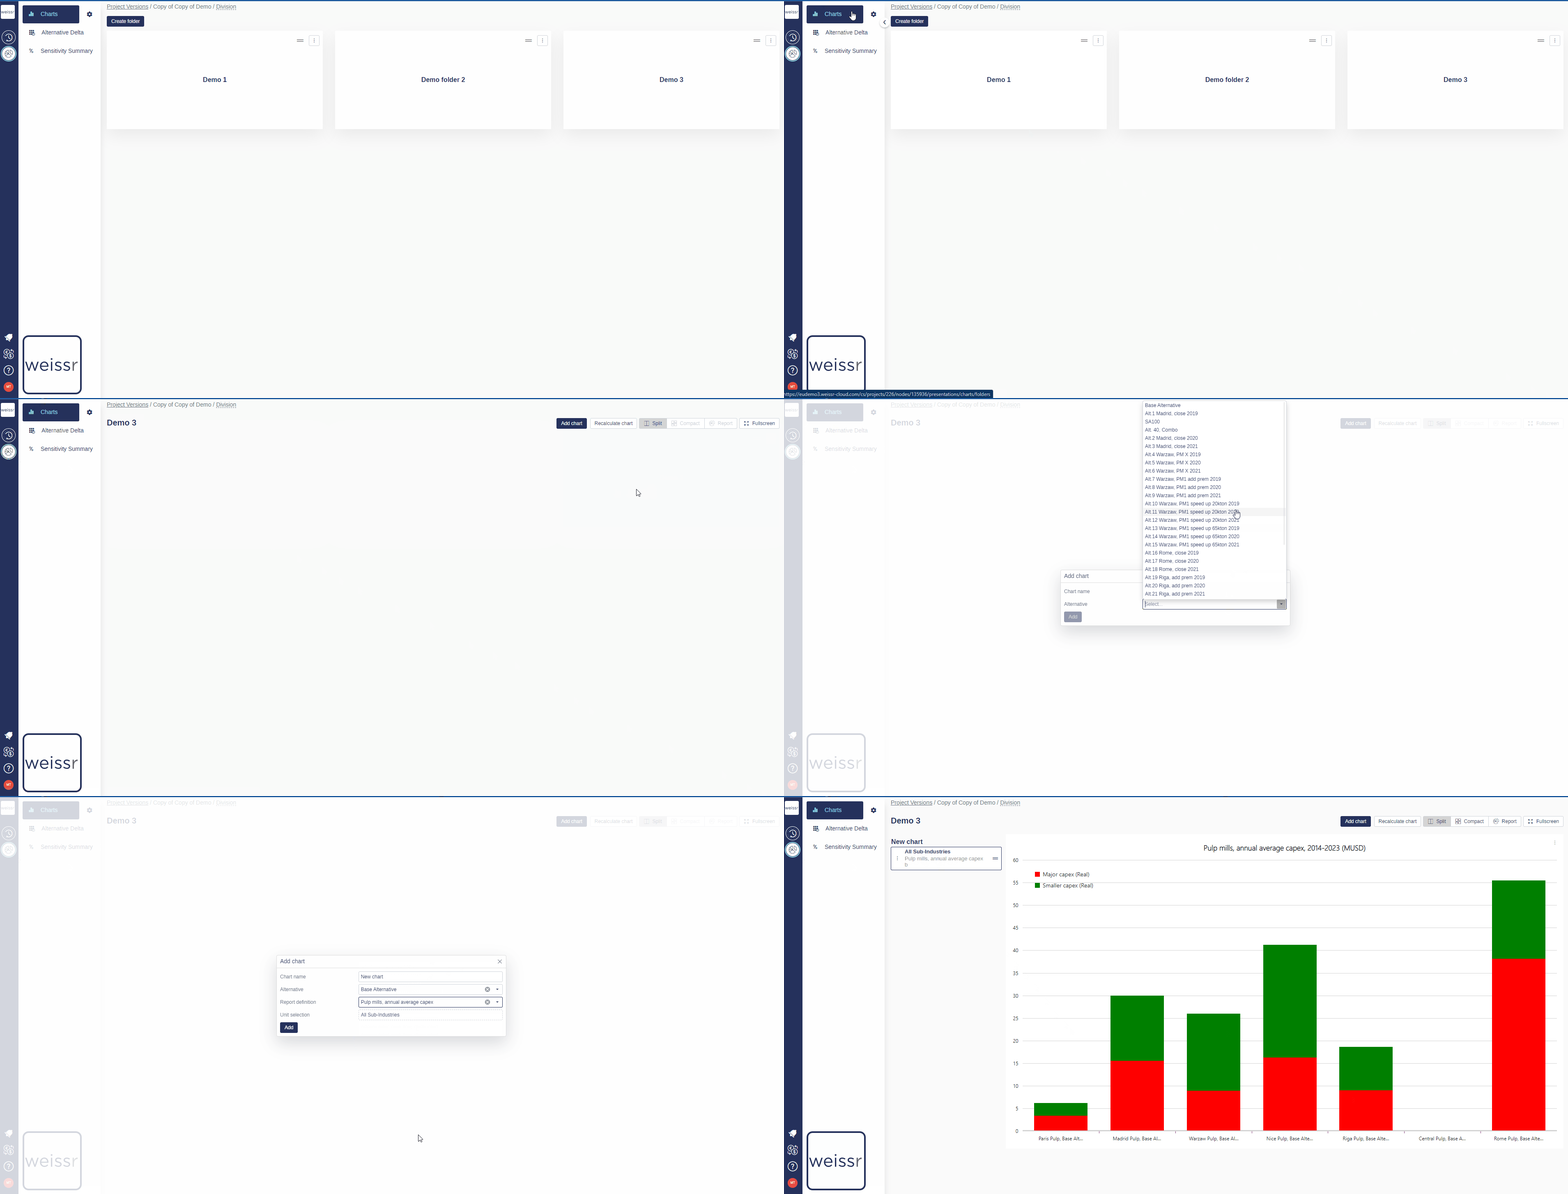
How to add a chart to a folder
You would like to add a chart from Reports to a specific folder in Presentations, here’s how
Make sure to be in the Presentations → Charts tab.
Open the folder you wish to add a chart to by clicking on it in the left panel of the window.
Click on Add Chart, located above the chart grid to develop the menu, follow the trail by hovering on the alternative the chart belongs to, the variable it is of, the entity/level it's on until you can't develop the menu anymore.
Once you found the right chart, click on it and wait a few seconds for the change to be operational.
