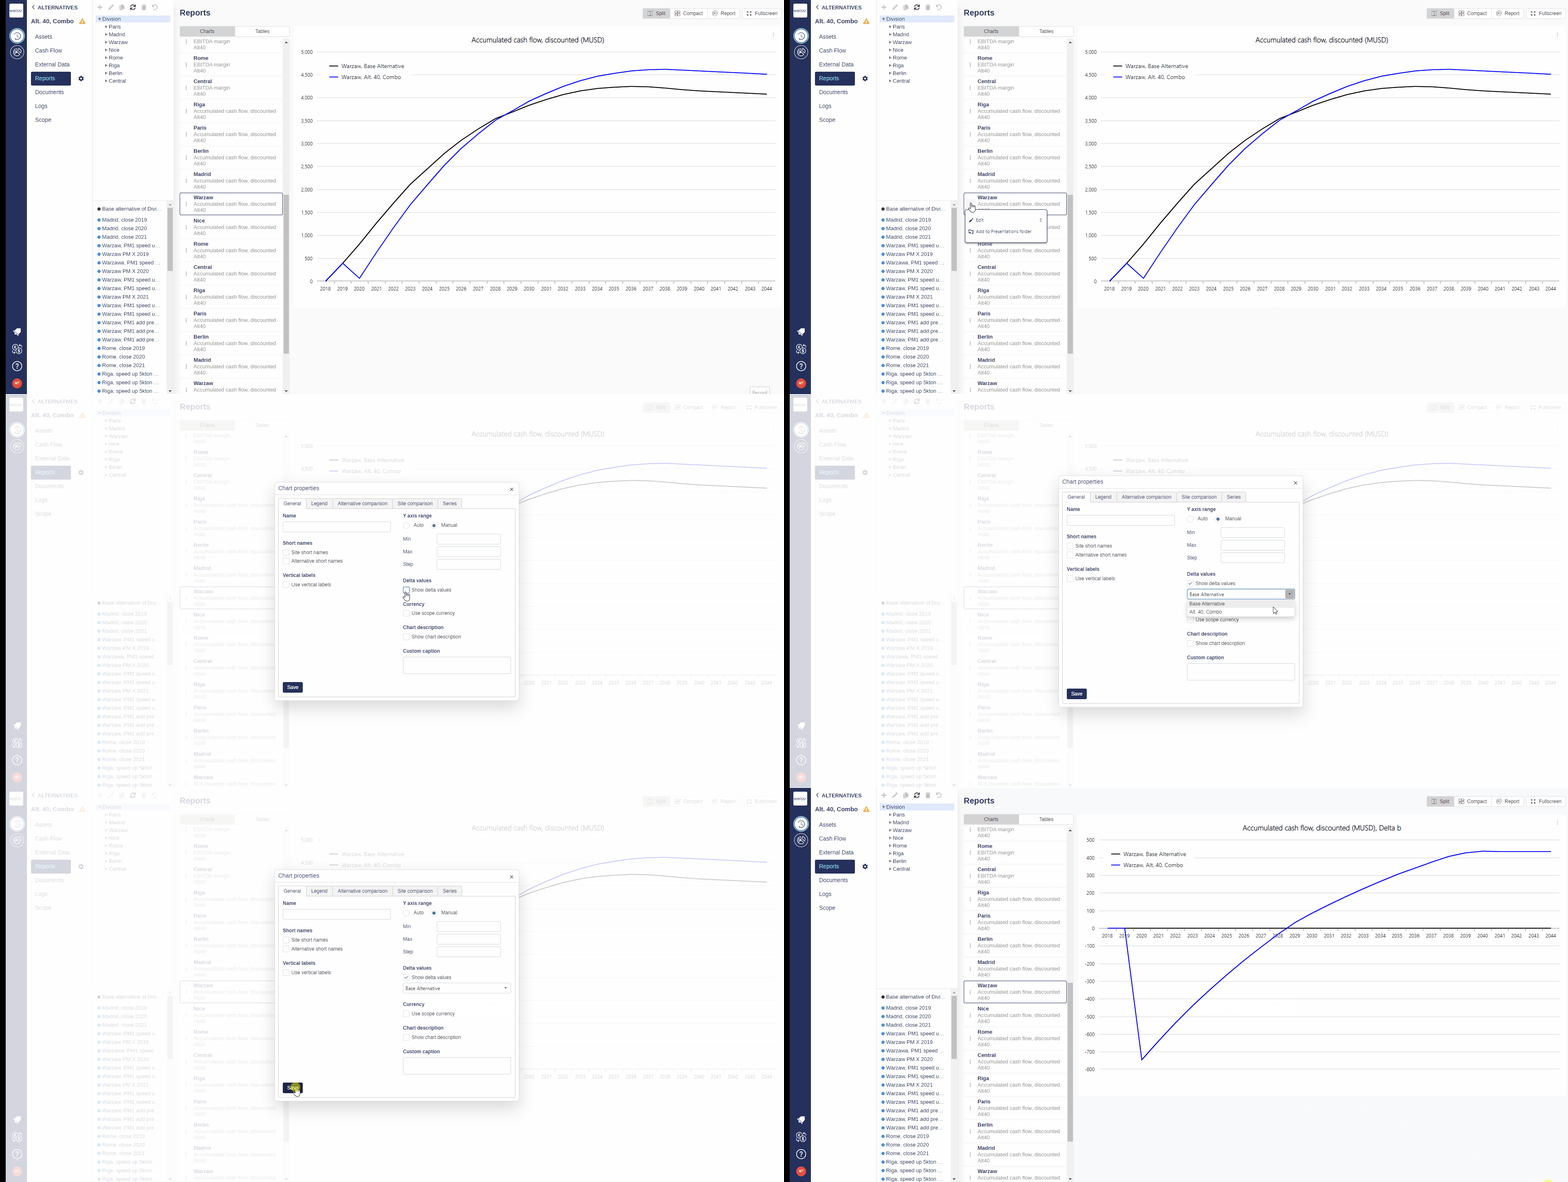
How to add a delta curve to a graph (Reports)
You would like to add a delta curve to a graph, here’s how
Make sure to be in the Base Alternative/Strategic Building Block/Strategic Alternative → Reports → Charts tab.
Navigate deep enough in the navigation tree on the left side of the screen to reach more easily the entity the chart in question belongs to (Division → Site → Sub-industry → Category).
Once you found the right chart in the right entity, click on it in the left panel of the main central window to make it appear in the right panel.
Once you can see the chart, click on the three dots located on the left of the graph description box, tick Show Delta values and select in the drop-down that appears what you want to show the values for (Base Alternative, Strategic Alternative etc.)
The original curve will now be the X-axis, showing how the added curve behaves relative to the original curve (making comparisons easier).
