How to export a graph as an image (Presentations)
You would like to export a graph in an image format, here’s how
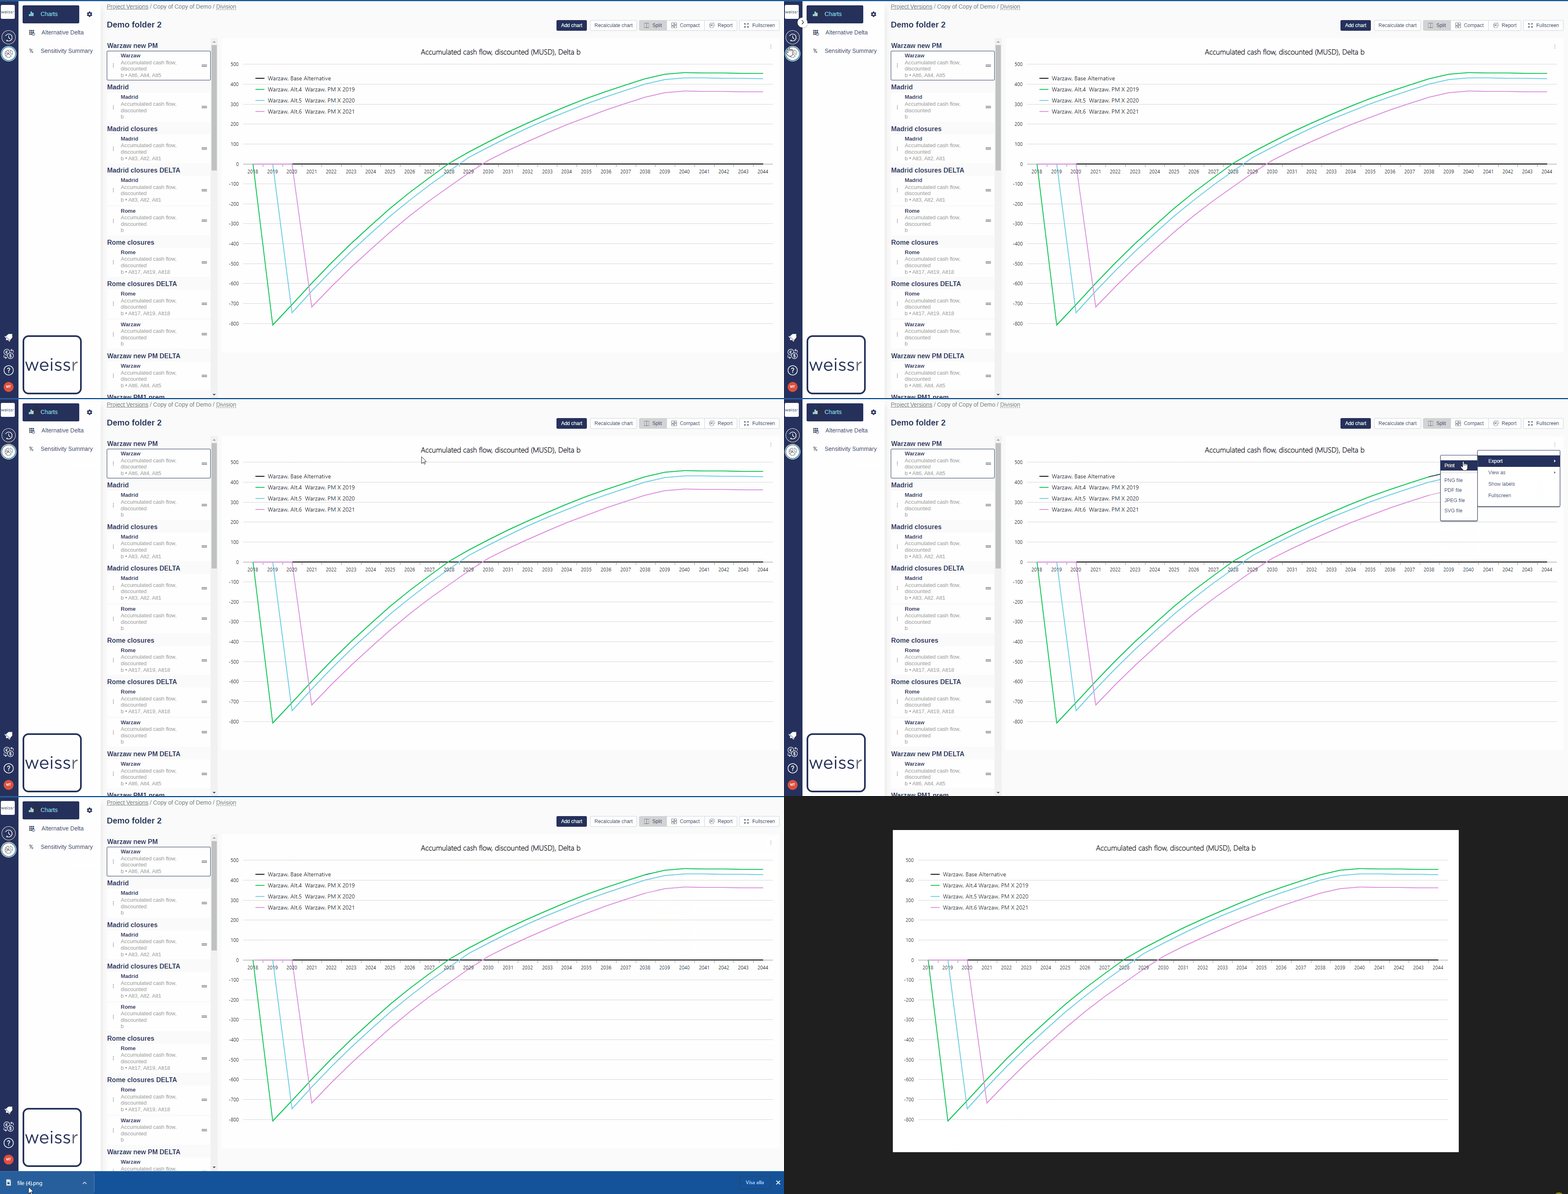
Make sure to be in the Presentations → Charts tab.
Select a folder in which the desired chart is located in.
Once you can see the chart in the grid, click on the three dots (context menu) located on the top right of the chart grid.
Select if you want to print the chart or download it as a PNG, PDF, JPEG or SVG file for export. If successful, the file should be visibly downloading at the bottom left of your screen.
