OCFD (Operating Cash Flow Demand)
OCFD is a system-calculated KPI in Weissr Capex Strategy, generated by the backend. You can calculate OCFD by simply addingSYS_OCFD as a formula in the model-building tool. OCFD is a core part of the CVA framework (Cash Value Added) and helps evaluate whether an investment is creating or destroying value over time.
Purpose of OCFD
OCFD represents the real cash-flow “rent” that an asset must generate annually to:
Cover the cost of capital (i.e. deliver the required return to investors and lenders, based on WACC)
Fully repay the original investment by the end of the asset’s useful life (like a repayment schedule, calculated as an annuity)
Preserve purchasing power over time (if inflation is included in the calculation)
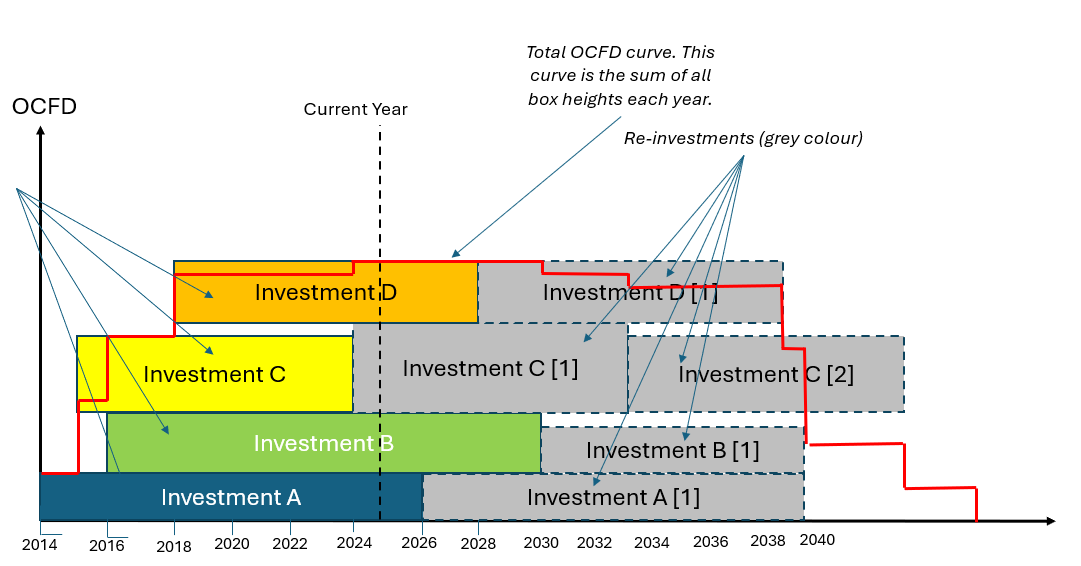
OCFD (Operating cash flow demand) answers the question: What is the required cash flow each year through the economic life to get the investment back (NPV = 0). The shorter the life, the higher the OCFD.
In theory, one can therefore compare actual operating cash flow to OCFD year by year and get a clear and consistent reference point, year by year.
Key points: | |
Calculated as a real-term annuity | One constant real payment that makes the NPV of the cash stream equal the initial investment. The real annuity is indexed for inflation each year. |
Year-by-year comparison | If Operating Cash Flow sits above OCFD, value is created (positive CVA); if it drops below, value is "destroyed" (negative CVA). |
OCFD in Weissr
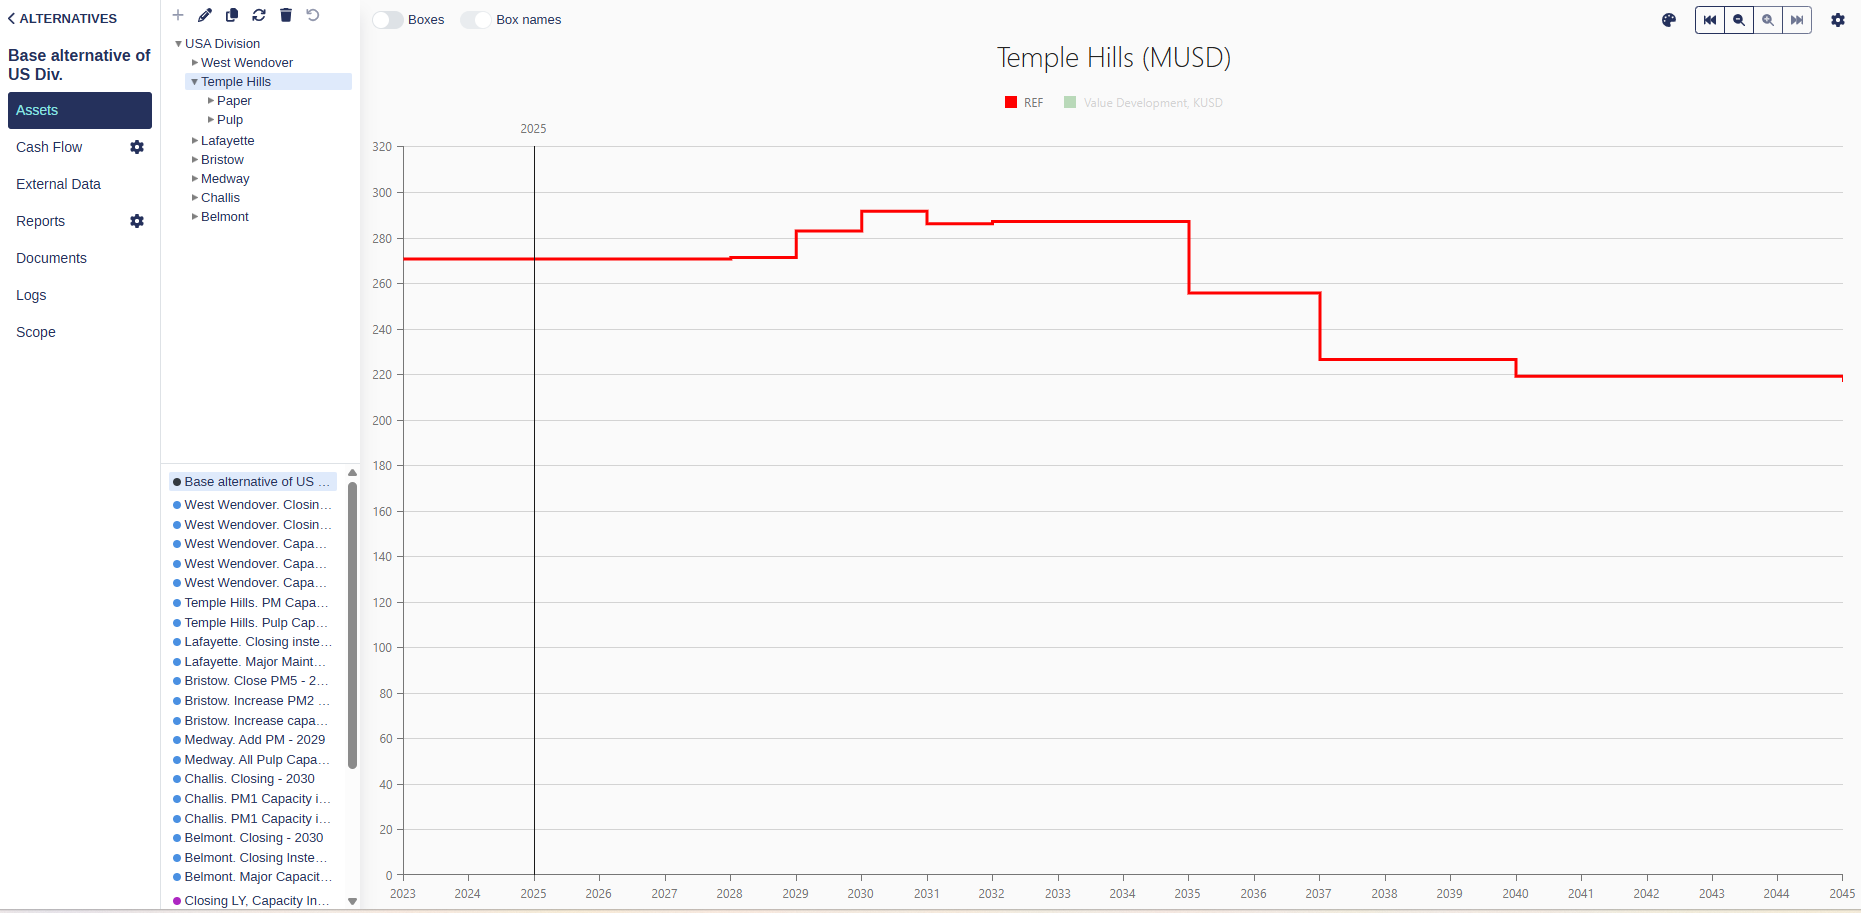
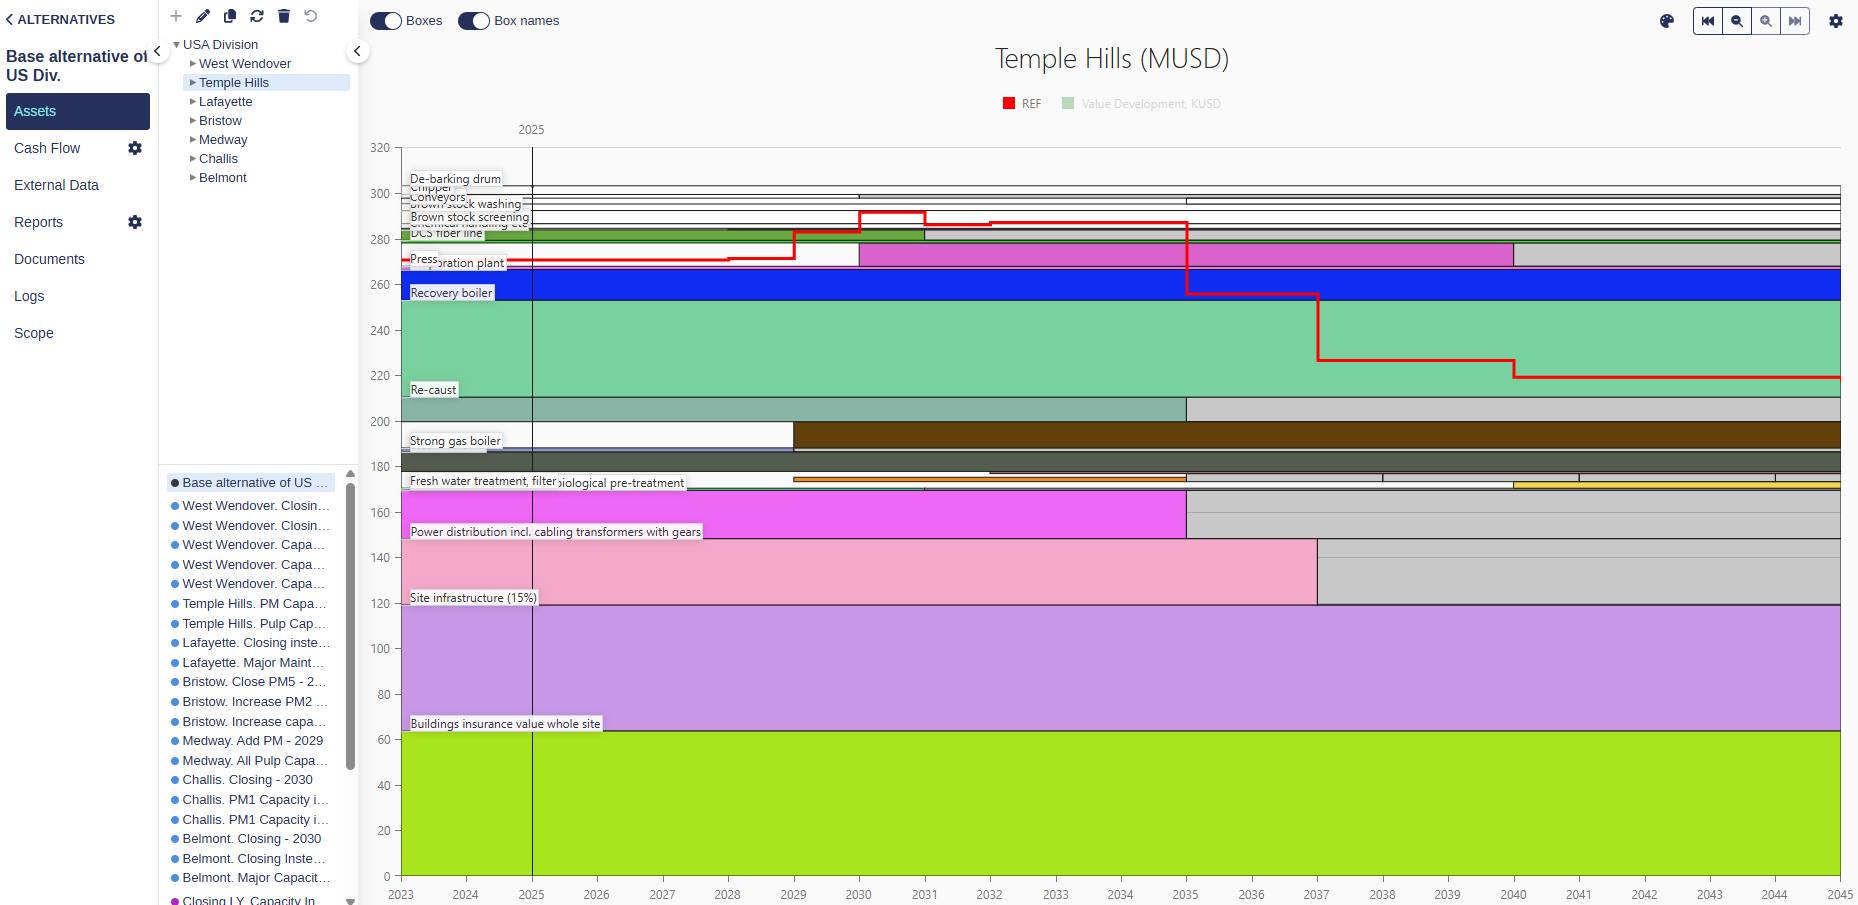
You can see the OCFD (red reference curve) in by going to Capex Strategy → Assets → Organisational Nodes (such as Production Site) → Investment Map.
Calculation and Example
OCFD is calculated as a real-term annuity:
It represents one constant real payment per year
The present value (NPV) of these payments equals the original investment
If inflation is enabled, the real annuity is indexed yearly
You calculate the annuity factor:
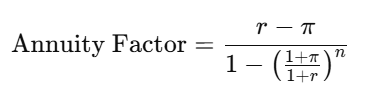
Where:
r = WACC (real discount rate)
π = inflation rate
n = asset lifetime (in years)
Once you have the annuity factor, simply multiply it by the investment/capex:
OCFD per year for an investment = Investment * Annuity Factor
SIMPLE EXAMPLE in the table below where:
r = 5%
π = 0%
n = 5%
Investment | Investment Year | Amount (€m) | Annuity Factor | OCFD (€m per each active year) | Years Active |
|---|---|---|---|---|---|
Investment A | 2025 | 10.0 | 0.2309748 | 2.309748 | 2025, 2026, 2027, 2028, 2029 |
Investment B | 2026 | 5.0 | 0.2309748 | 1.154874 | 2026, 2027, 2028, 2029, 2030 |